
20 Q
6th - Uni
19 Q
6th - Uni
20 Q
7th - 12th
20 Q
7th - Uni
20 Q
4th - Uni
20 Q
5th - Uni
15 Q
7th - Uni
20 Q
6th - Uni
20 Q
6th - Uni
10 Q
6th - Uni
26 Q
8th
21 Q
8th
20 Q
6th - Uni
10 Q
6th - 8th
20 Q
6th - Uni
10 Q
6th - Uni
10 Q
6th - Uni
15 Q
6th - Uni
9 Q
7th - 12th
15 Q
7th - Uni
21 Q
8th
11 Q
4th - Uni
20 Q
6th - Uni
14 Q
7th - Uni
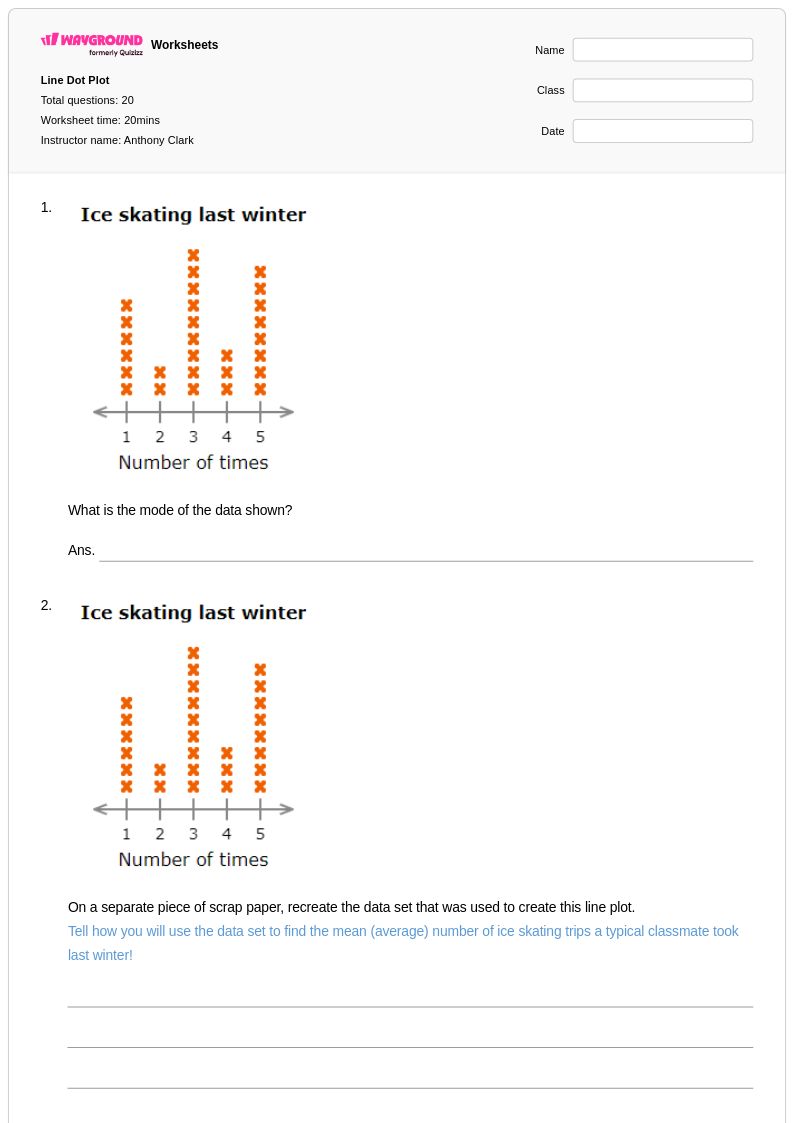
Explore Other Subject Worksheets for class 8
Explore printable Dot Plot worksheets for Class 8
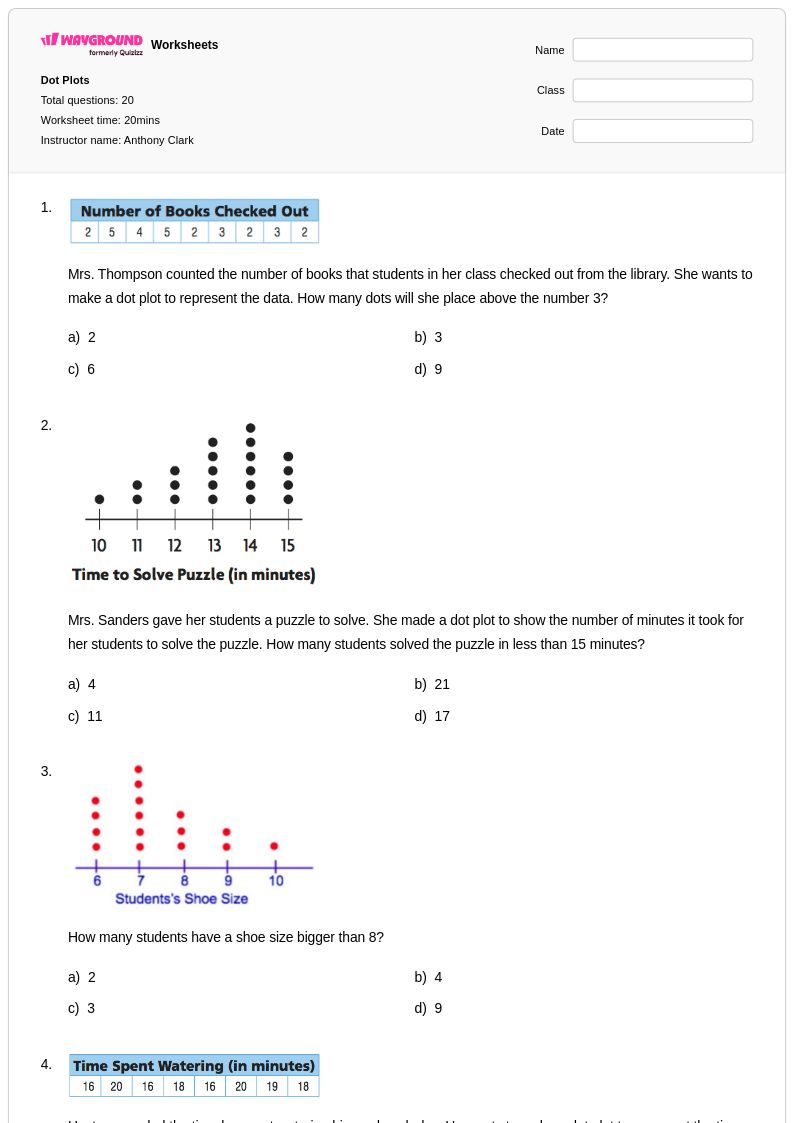
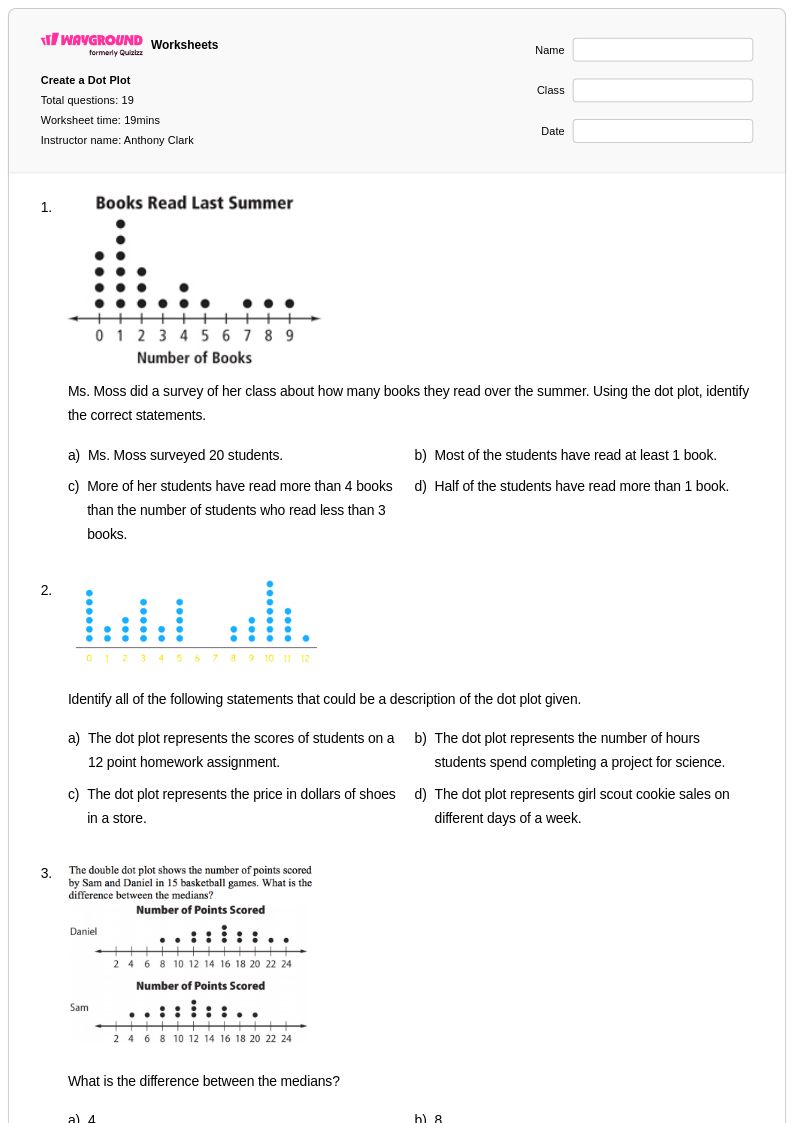
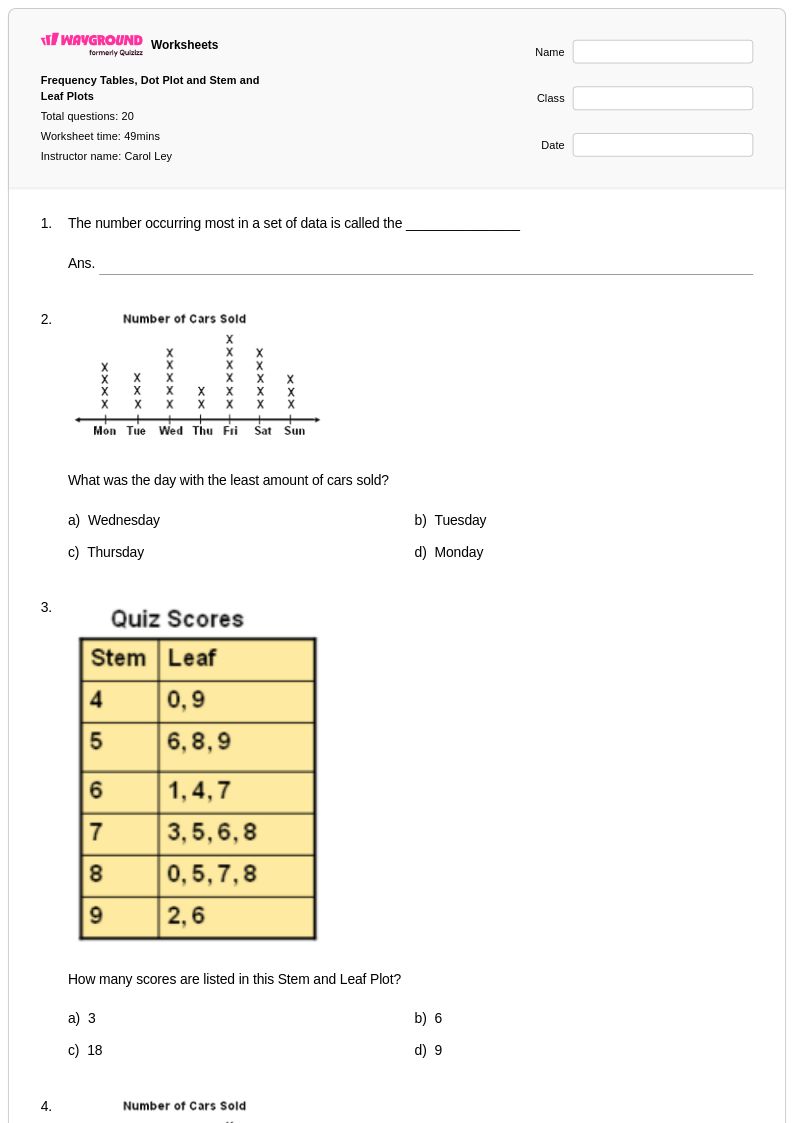
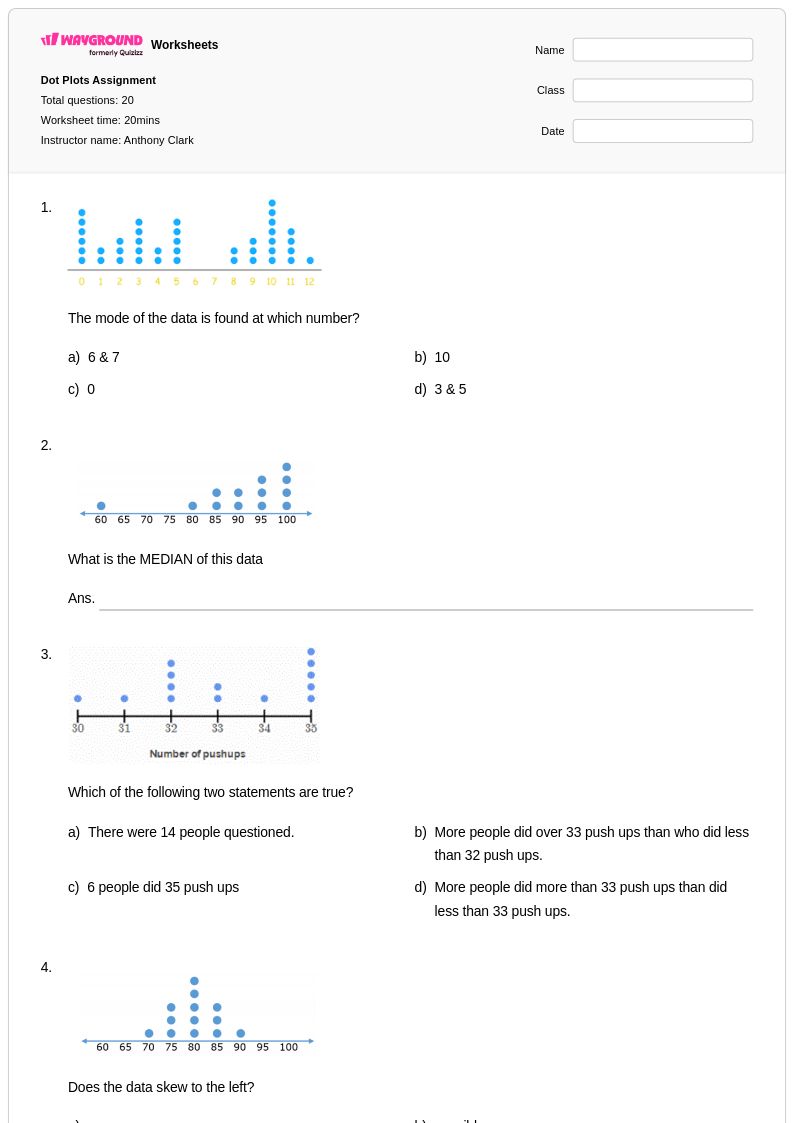
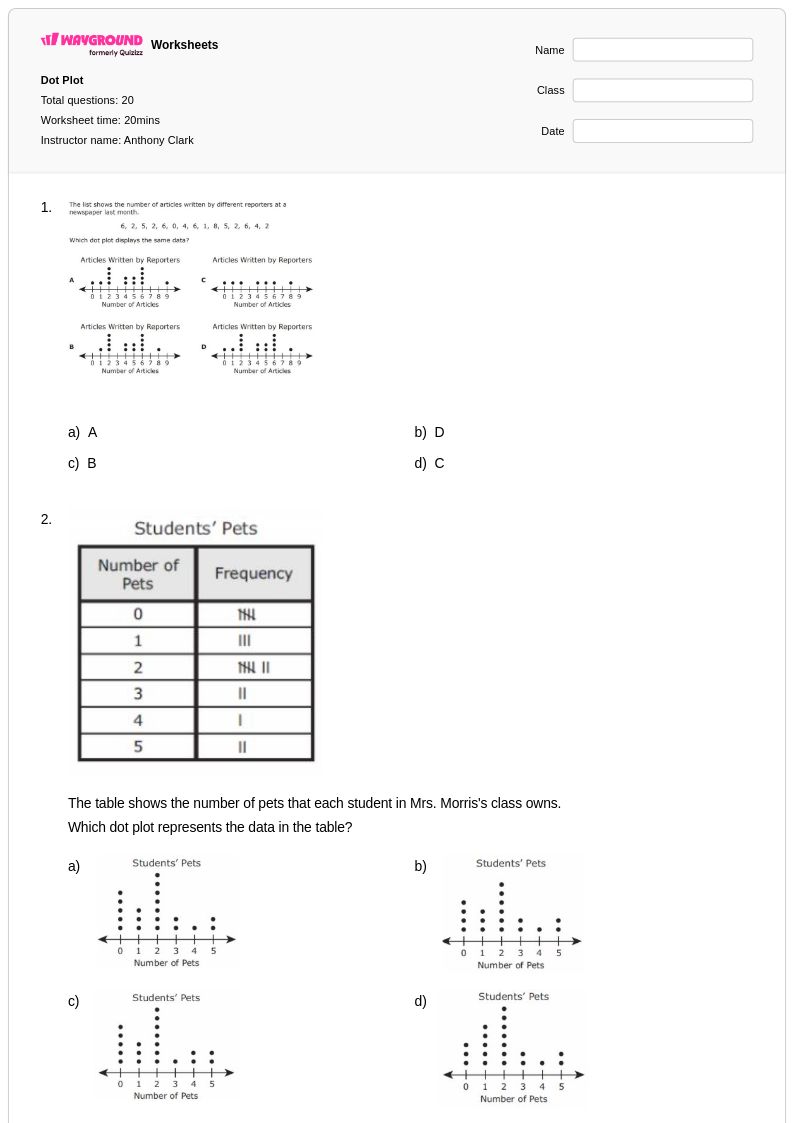
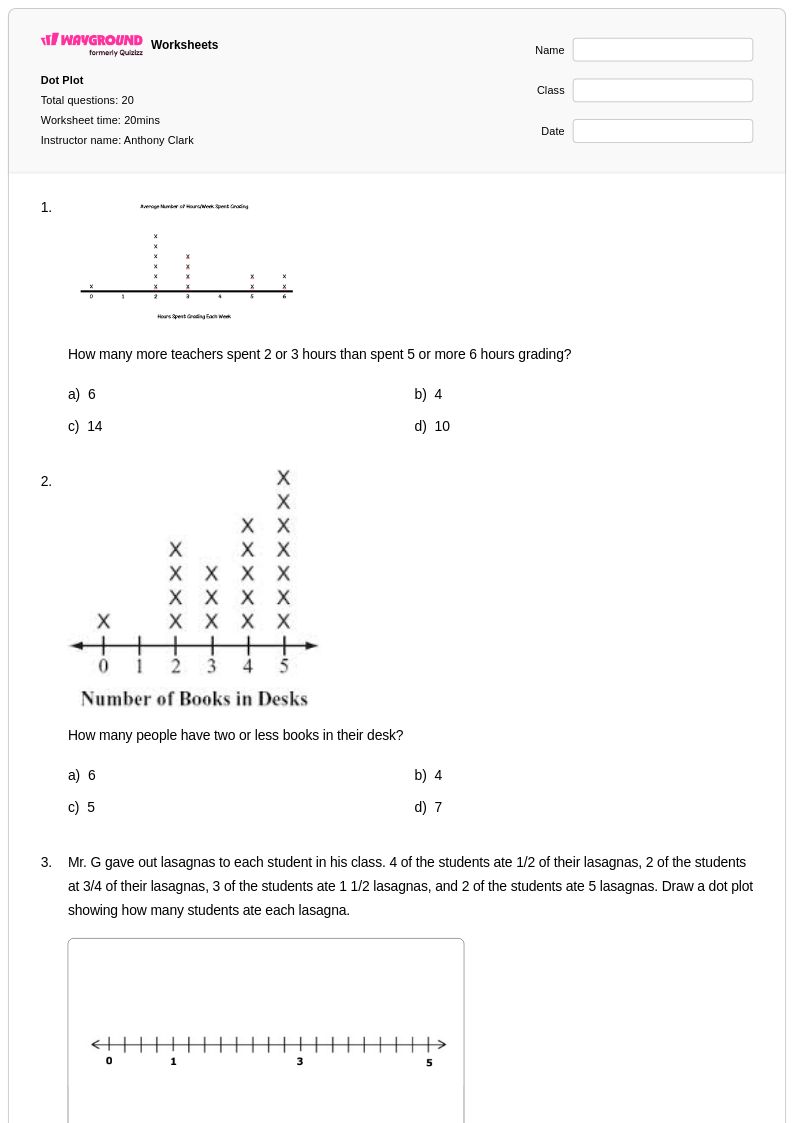
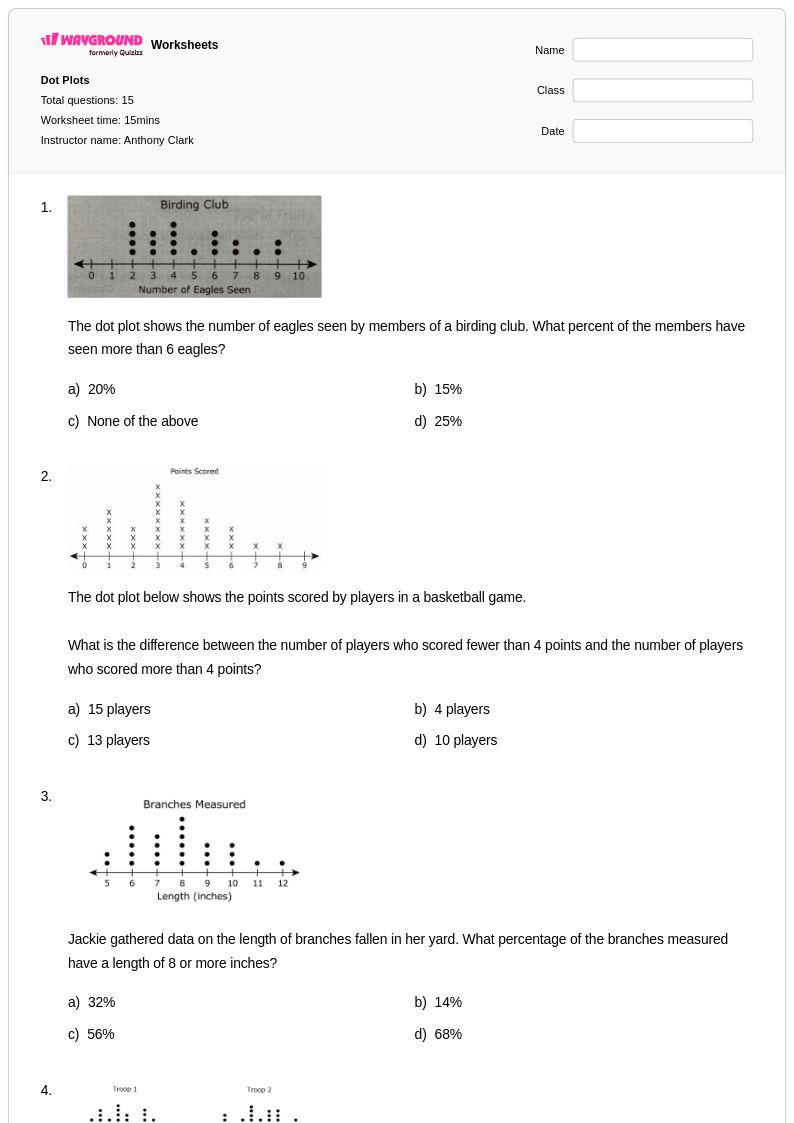
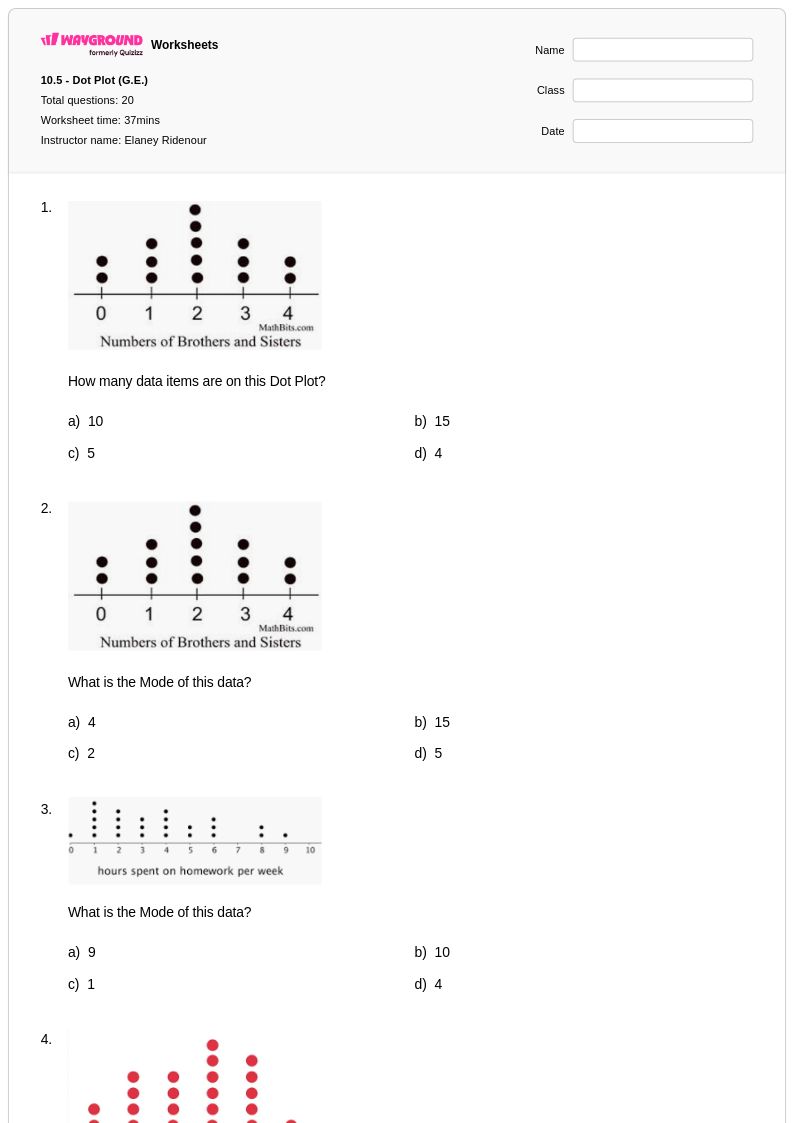
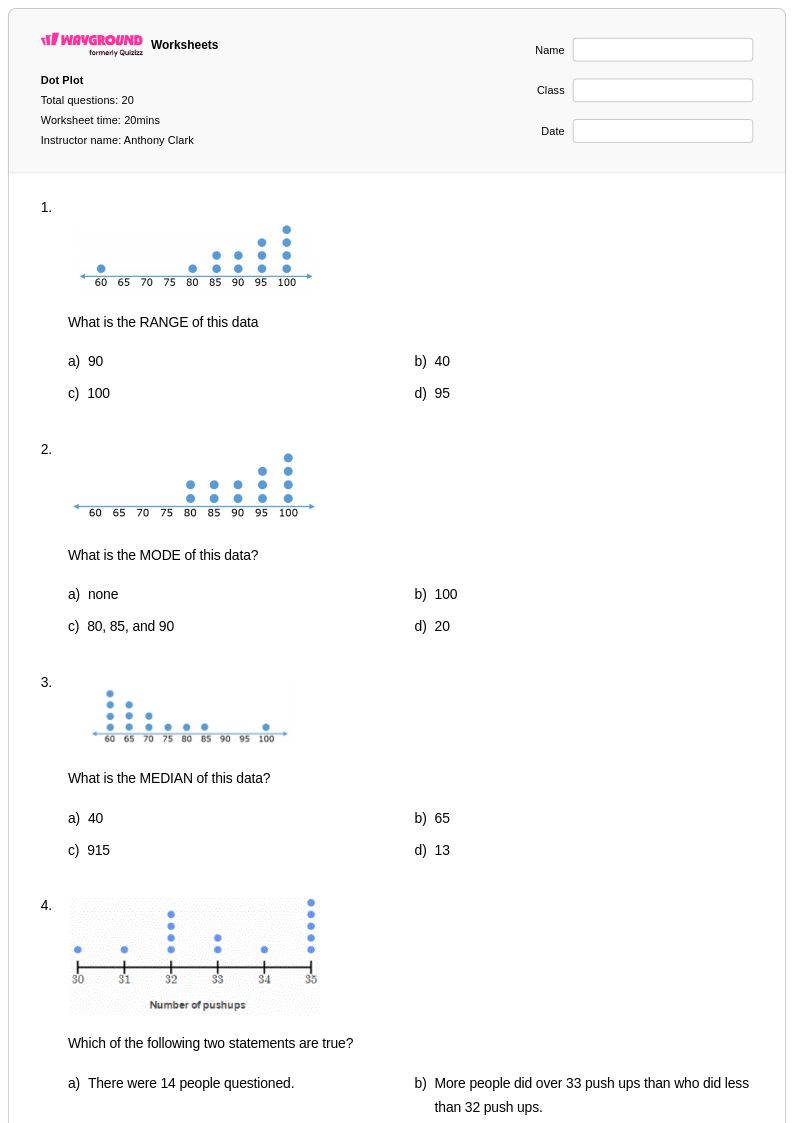
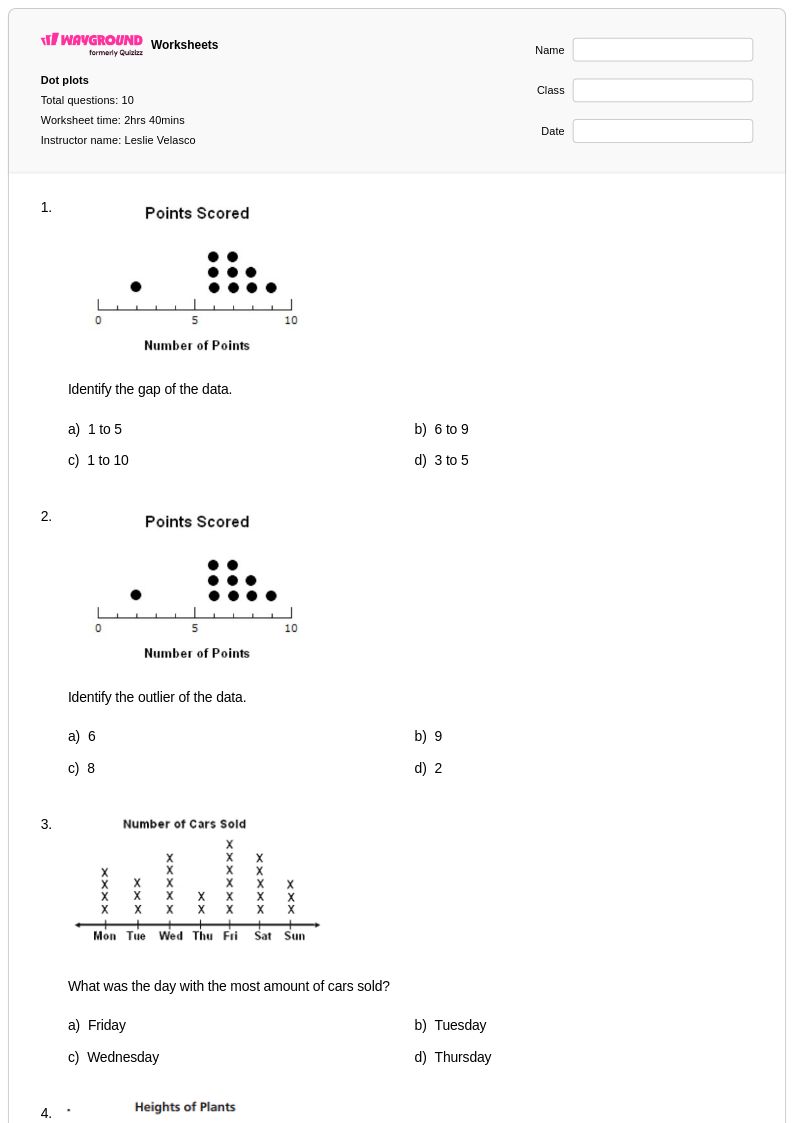
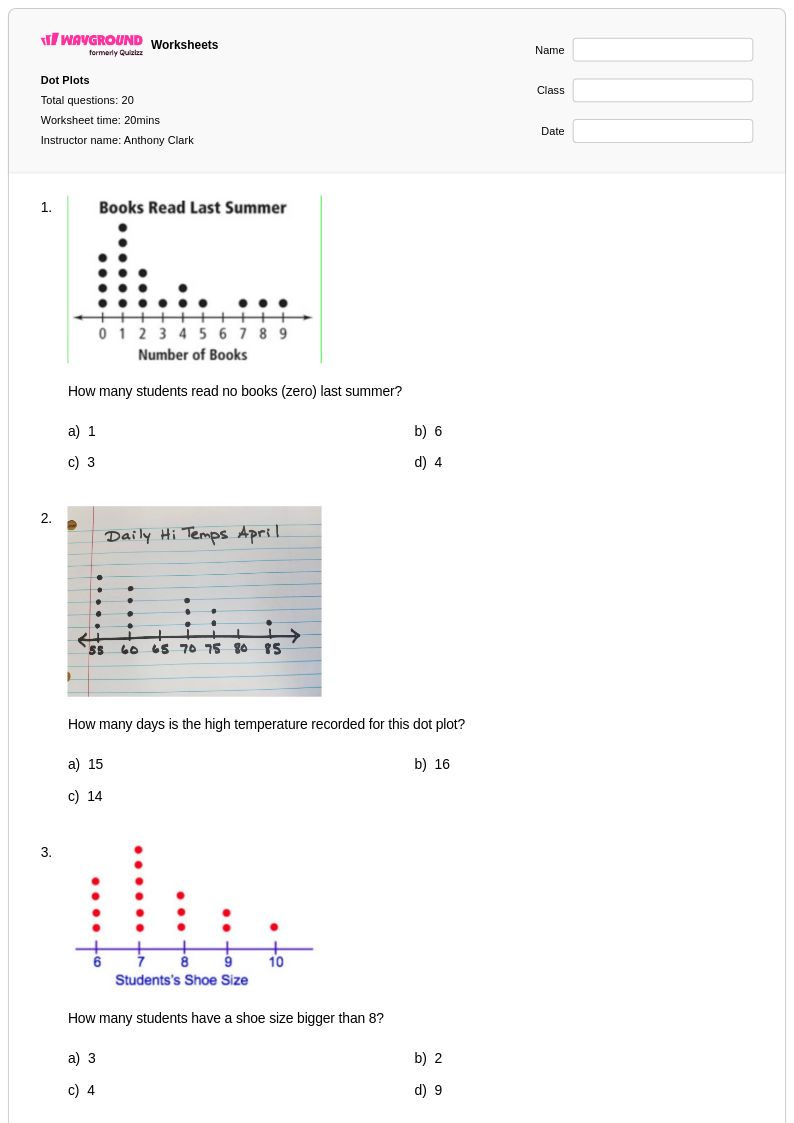
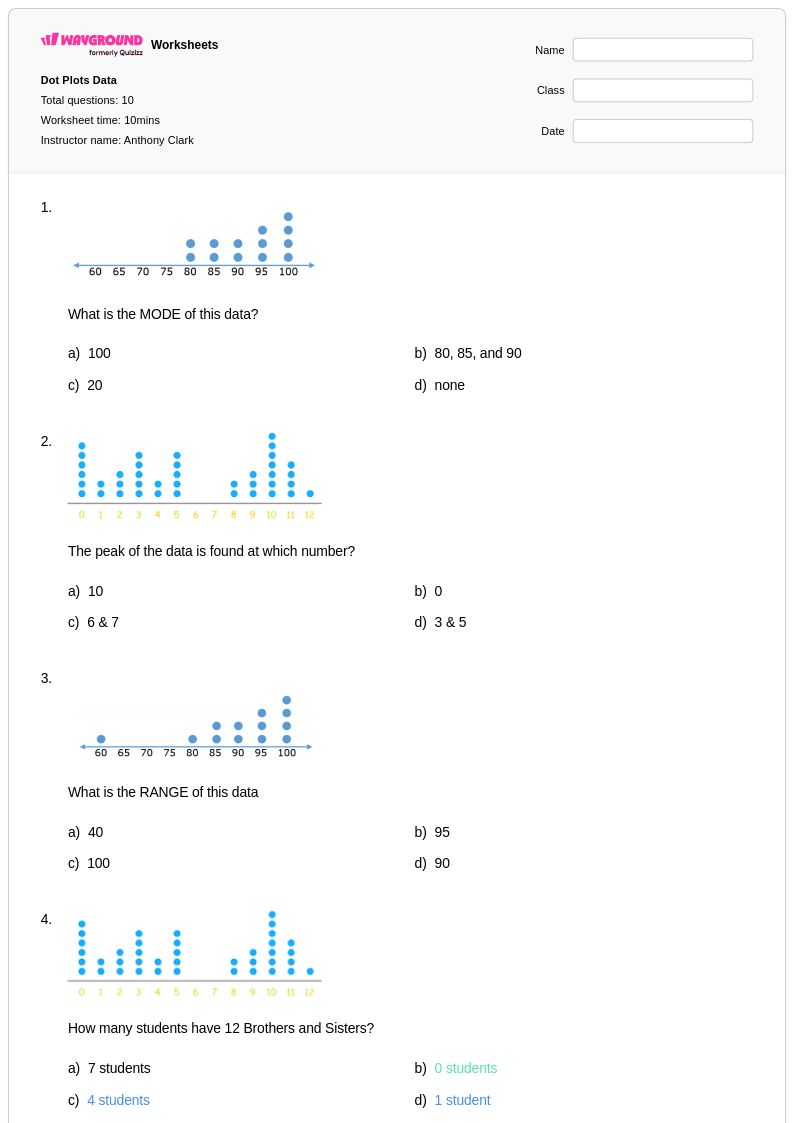
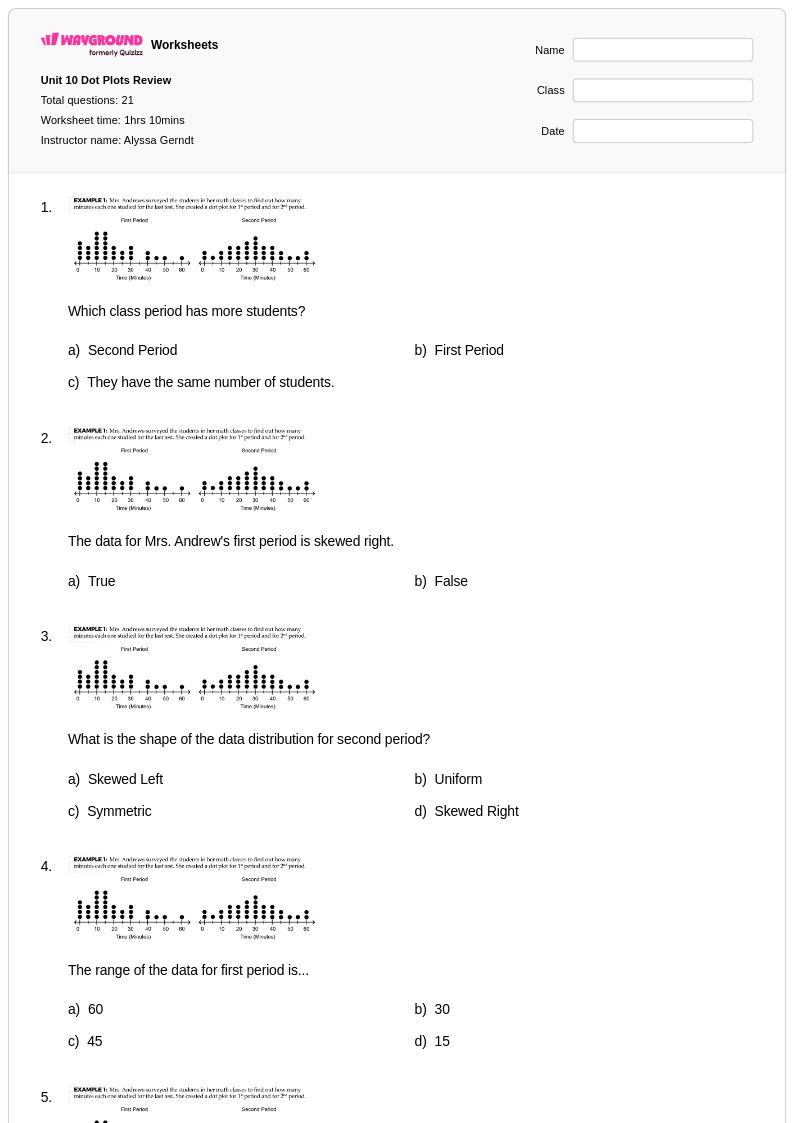
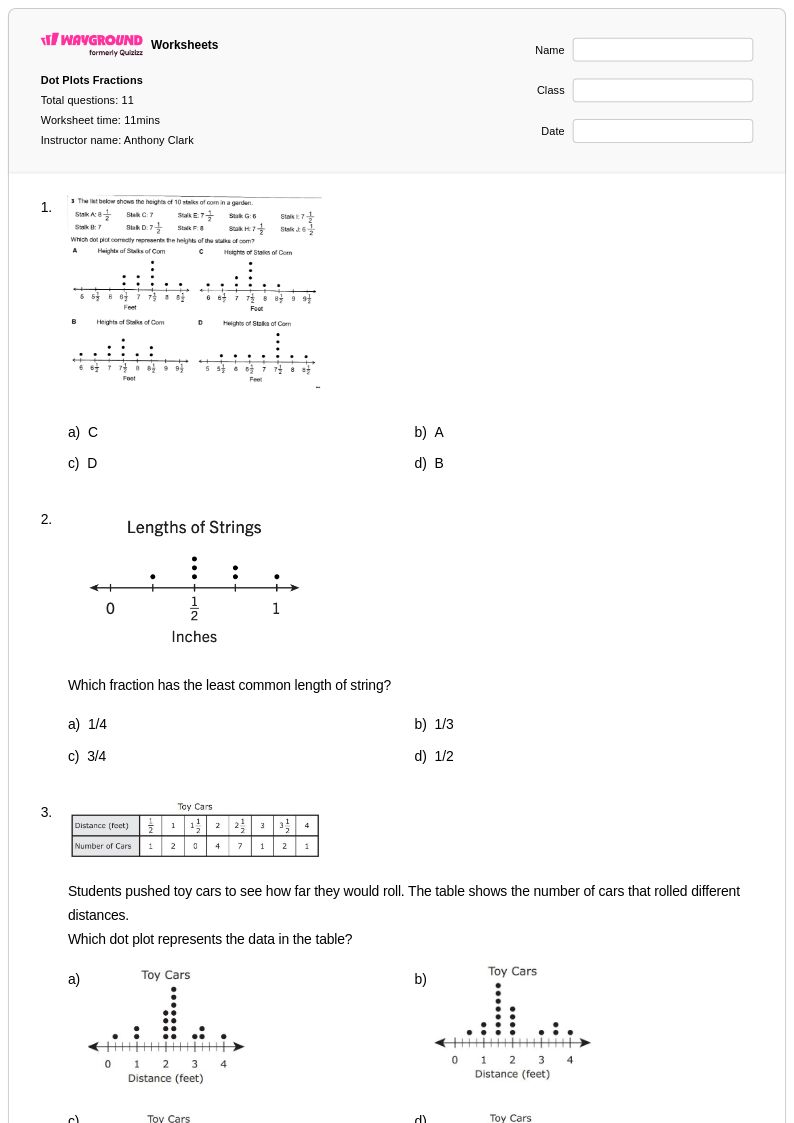
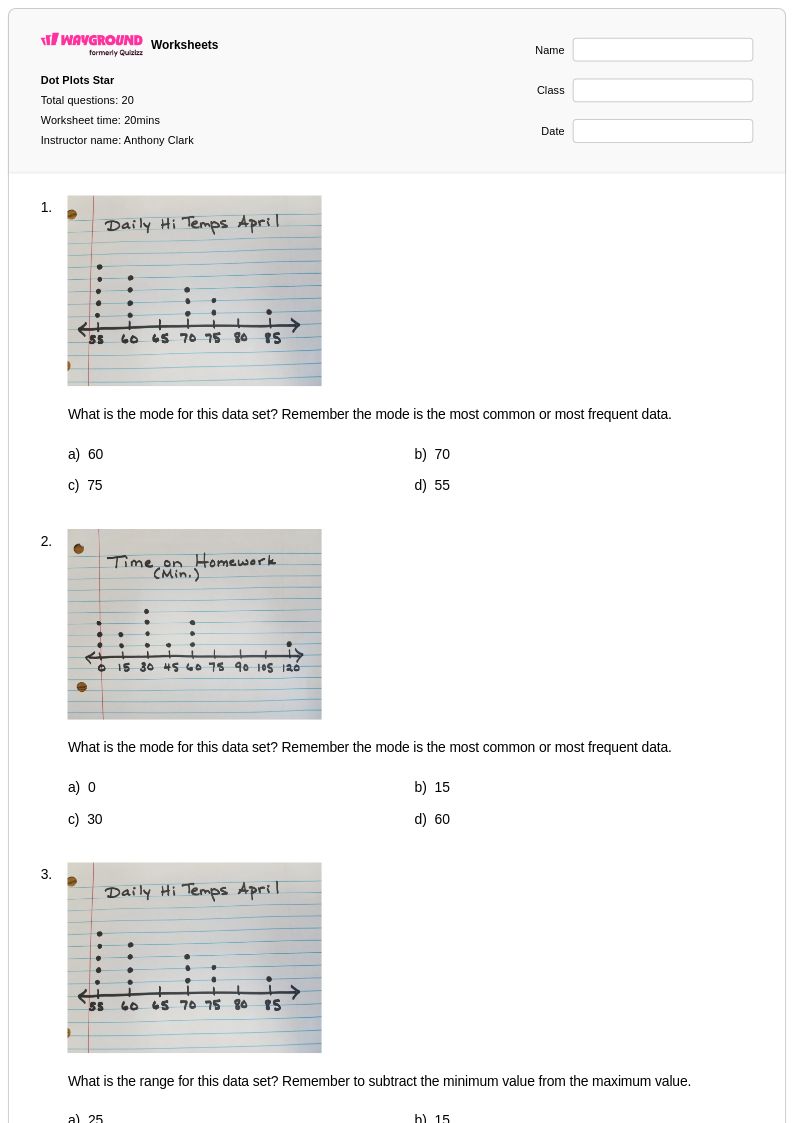
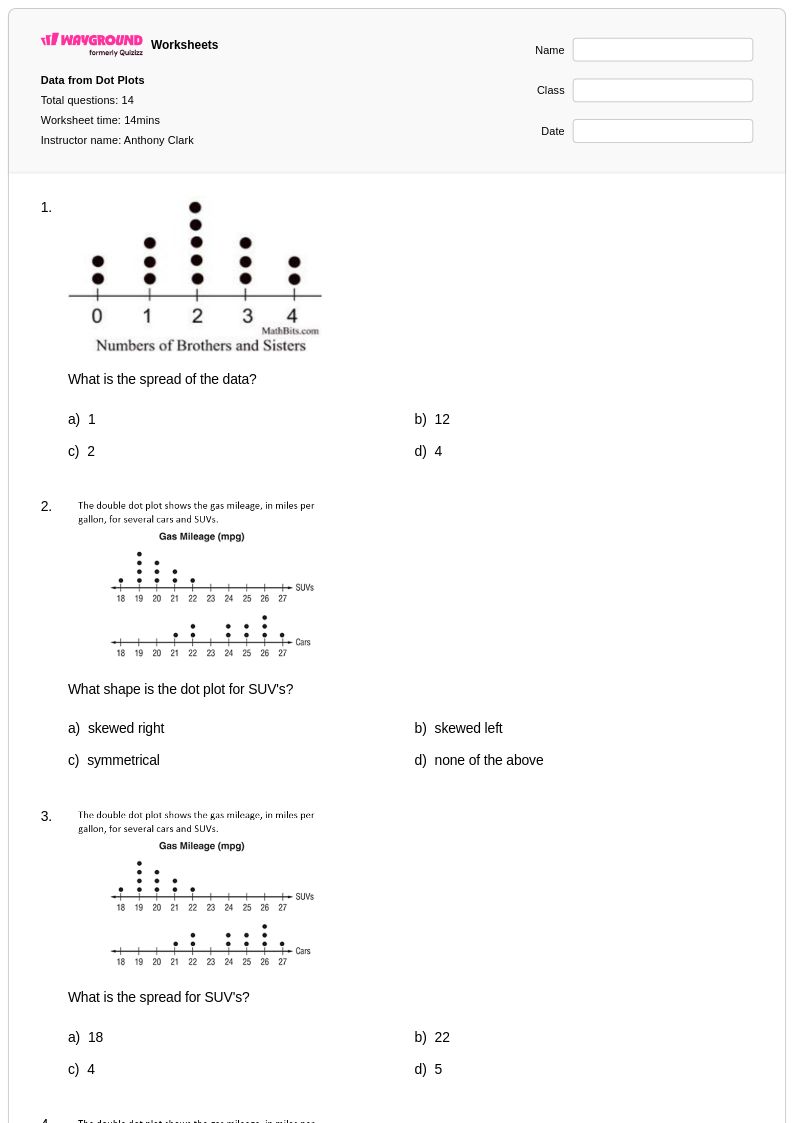
Dot plot worksheets for Class 8 mathematics provide students with essential practice in creating, interpreting, and analyzing one of the most fundamental data visualization tools. These comprehensive worksheet collections available through Wayground (formerly Quizizz) focus on developing critical statistical literacy skills including reading data from dot plots, identifying patterns and trends, calculating measures of central tendency, and recognizing the distribution shape of datasets. Students work through practice problems that range from basic dot plot construction using small datasets to more complex analysis involving multiple data sets and comparative studies. Each worksheet includes detailed answer keys that support independent learning and self-assessment, while the free printable pdf format ensures easy classroom distribution and homework assignments.
Wayground (formerly Quizizz) empowers educators with access to millions of teacher-created dot plot resources specifically designed for Class 8 mathematics instruction. The platform's robust search and filtering capabilities allow teachers to quickly locate worksheets that align with specific curriculum standards and match their students' skill levels, whether for initial concept introduction, targeted remediation, or advanced enrichment activities. Teachers can customize existing worksheets or create entirely new ones using the platform's flexible tools, then seamlessly distribute materials in both digital and printable formats to accommodate diverse classroom needs. This extensive collection supports differentiated instruction by offering varying complexity levels within dot plot concepts, enabling educators to provide appropriate challenges for all learners while maintaining focus on essential data analysis and graphing skills that form the foundation for advanced statistical thinking.