Free Printable Empirical Rule Worksheets for Class 9
Master Class 9 Empirical Rule concepts with Wayground's comprehensive collection of free worksheets, printables, and practice problems featuring detailed answer keys to strengthen probability and statistics skills.
Explore printable Empirical Rule worksheets for Class 9
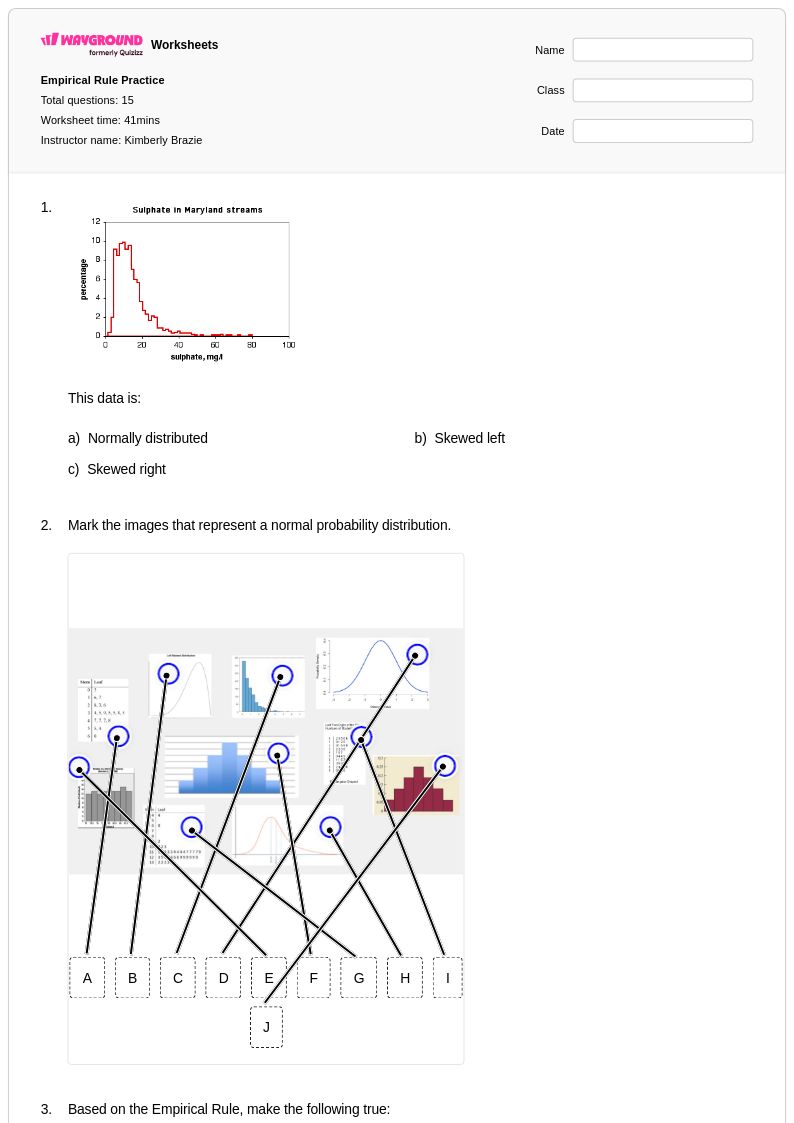
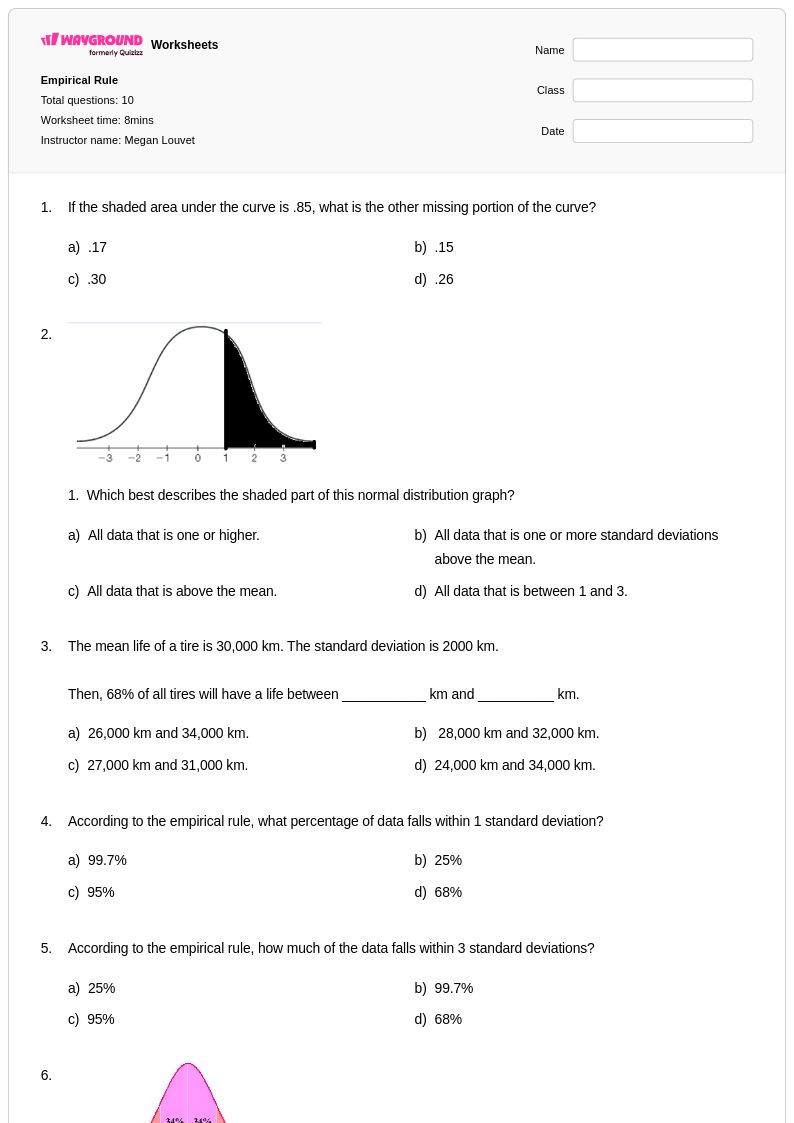
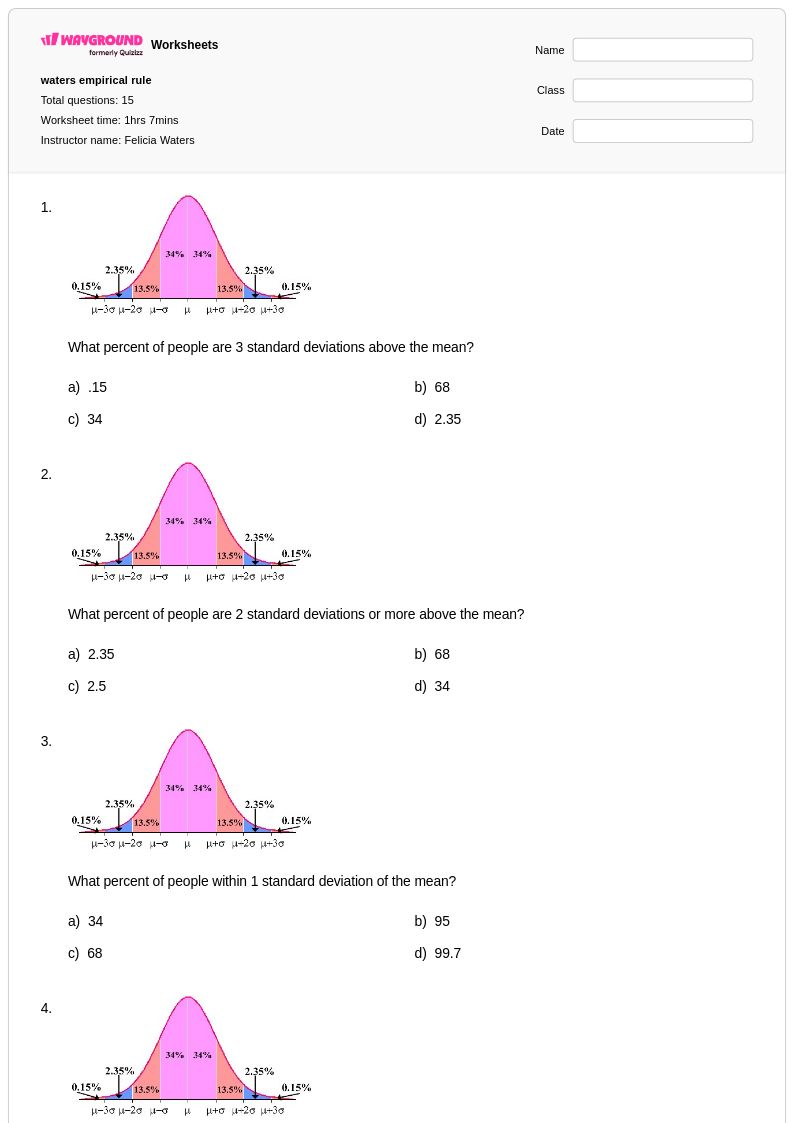
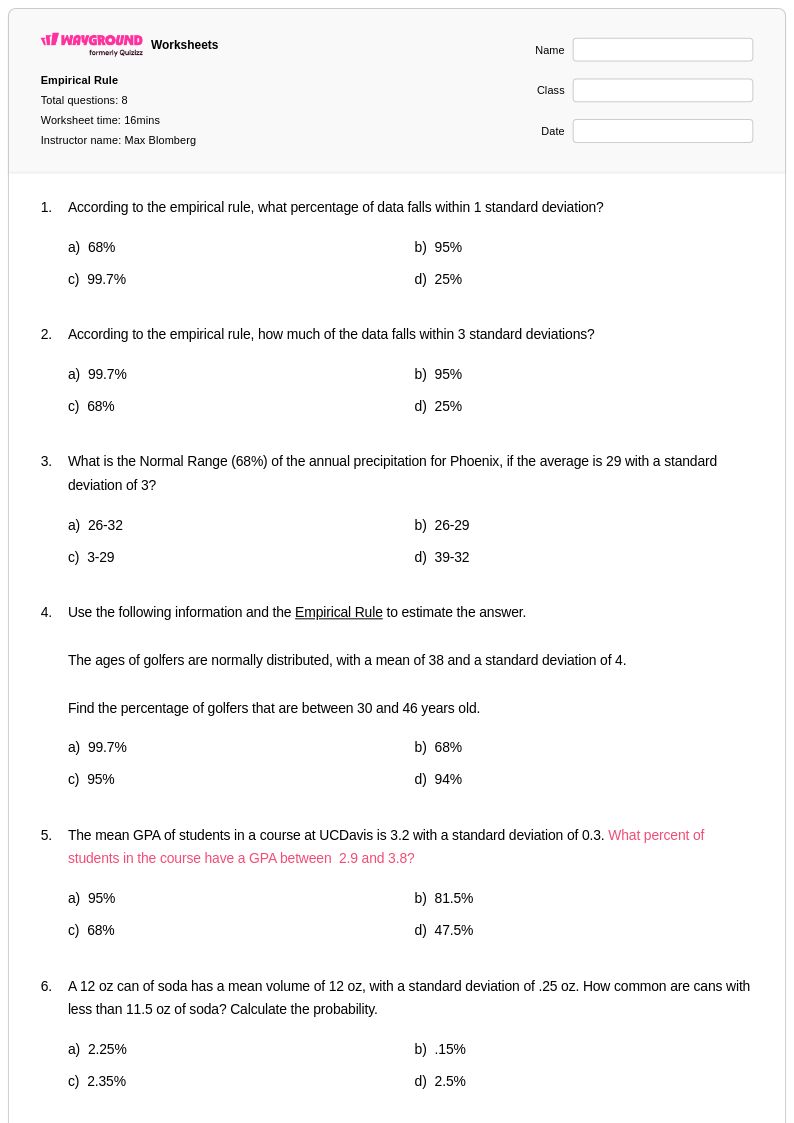
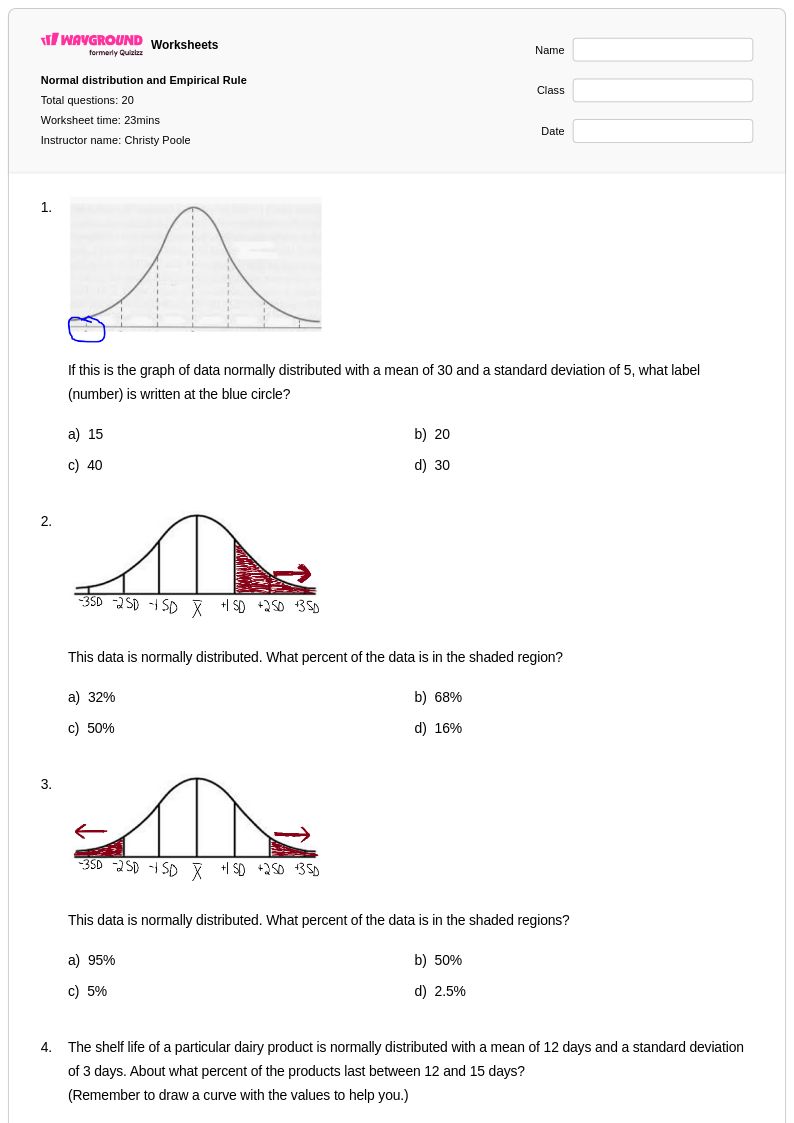
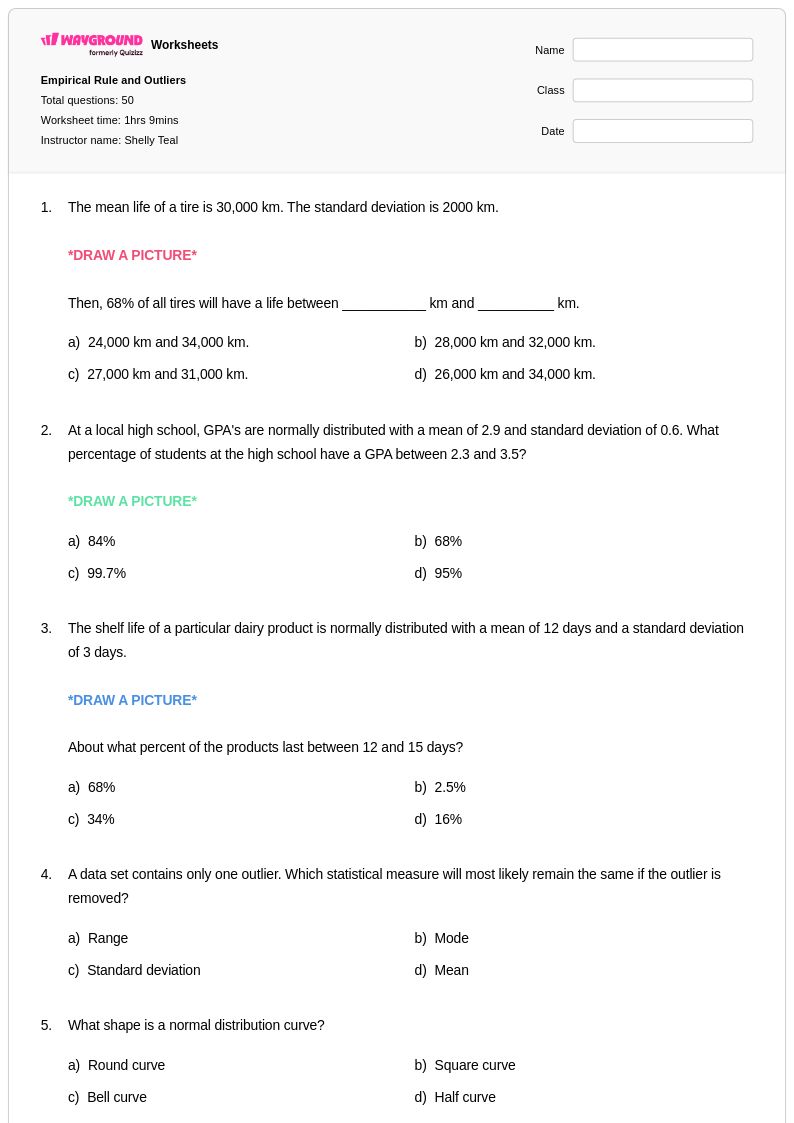
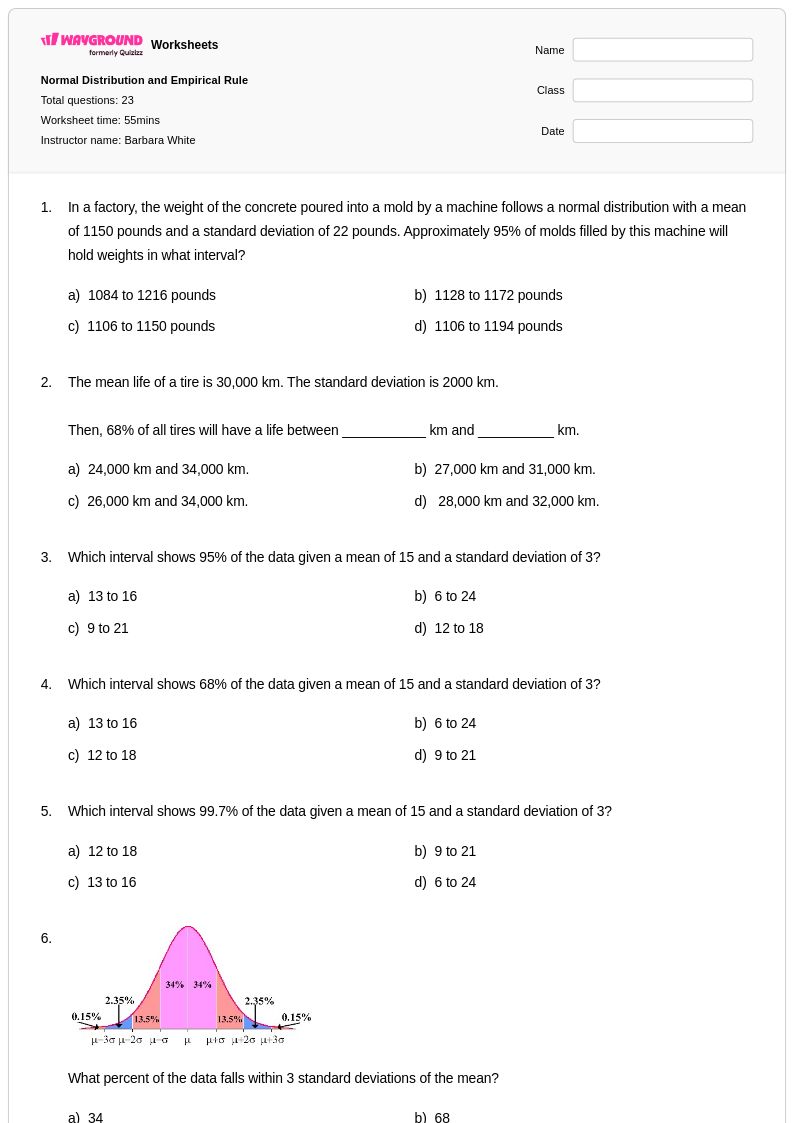
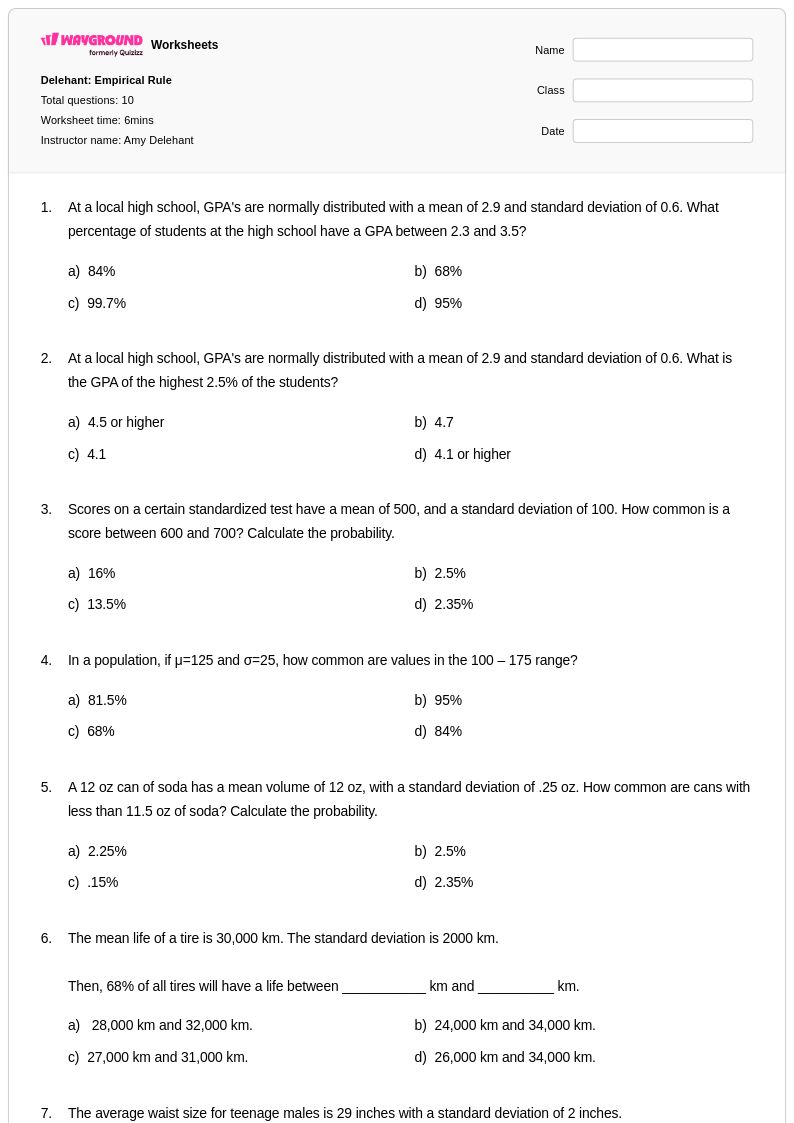
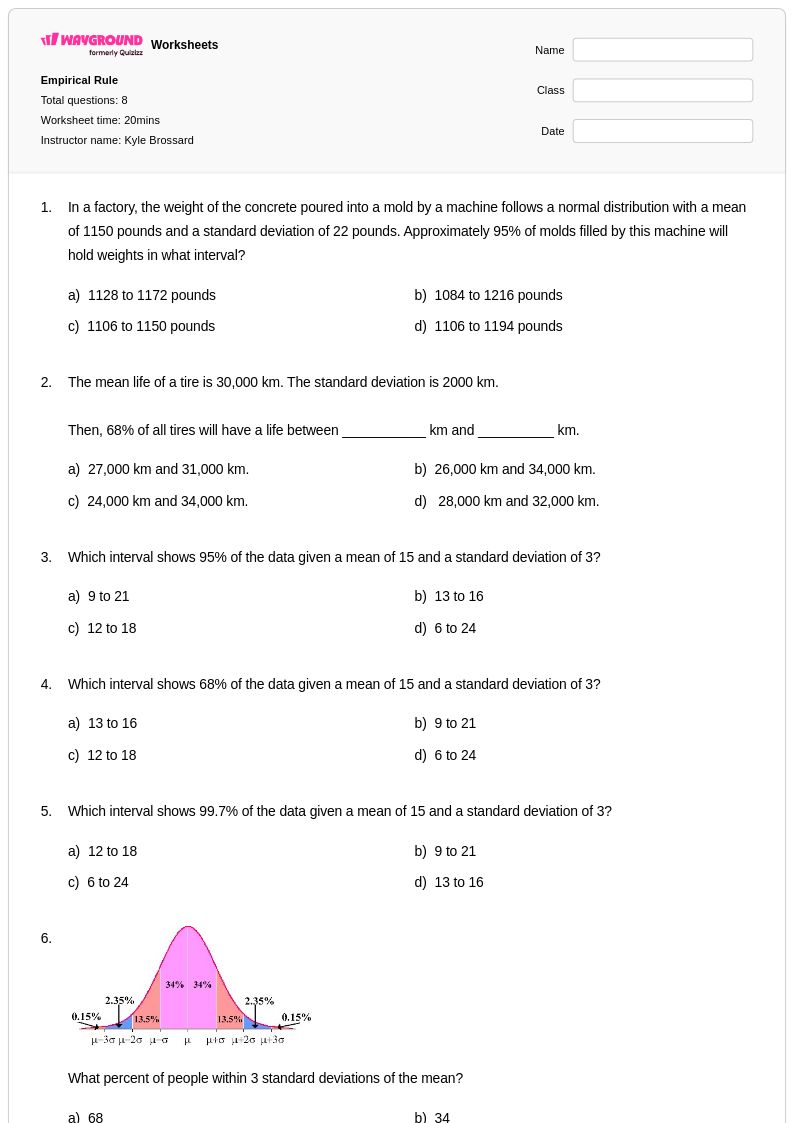
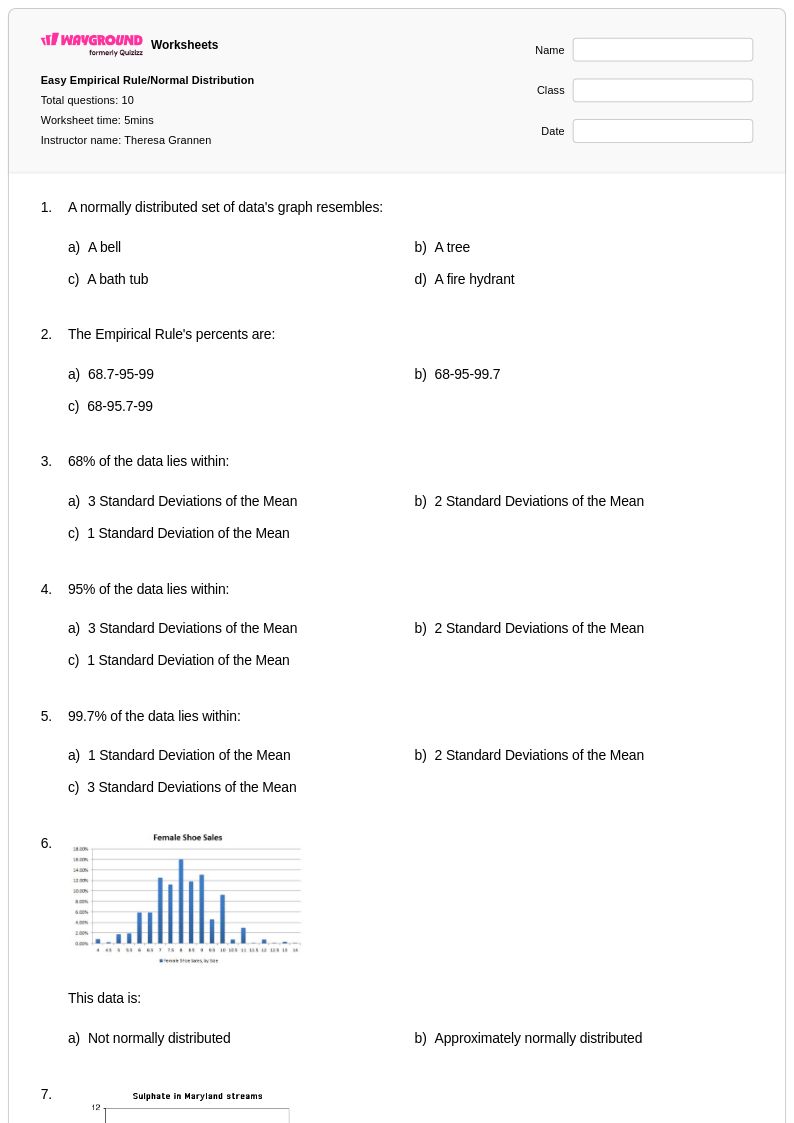
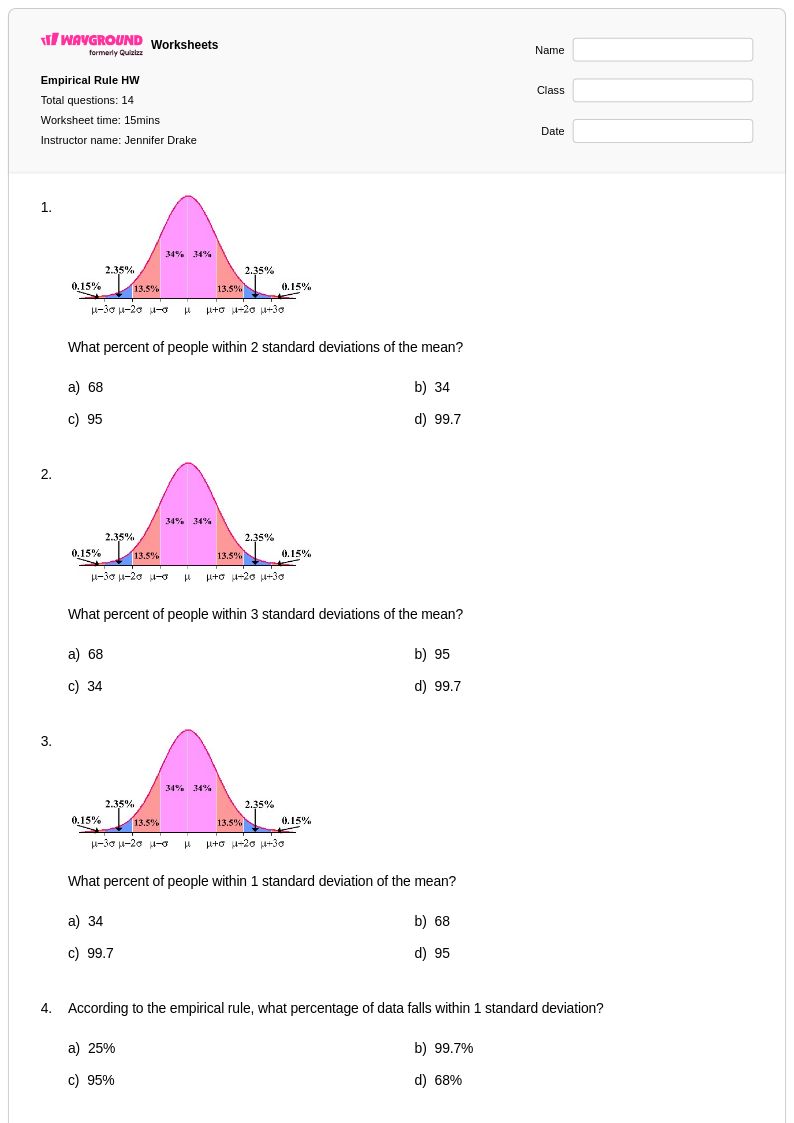
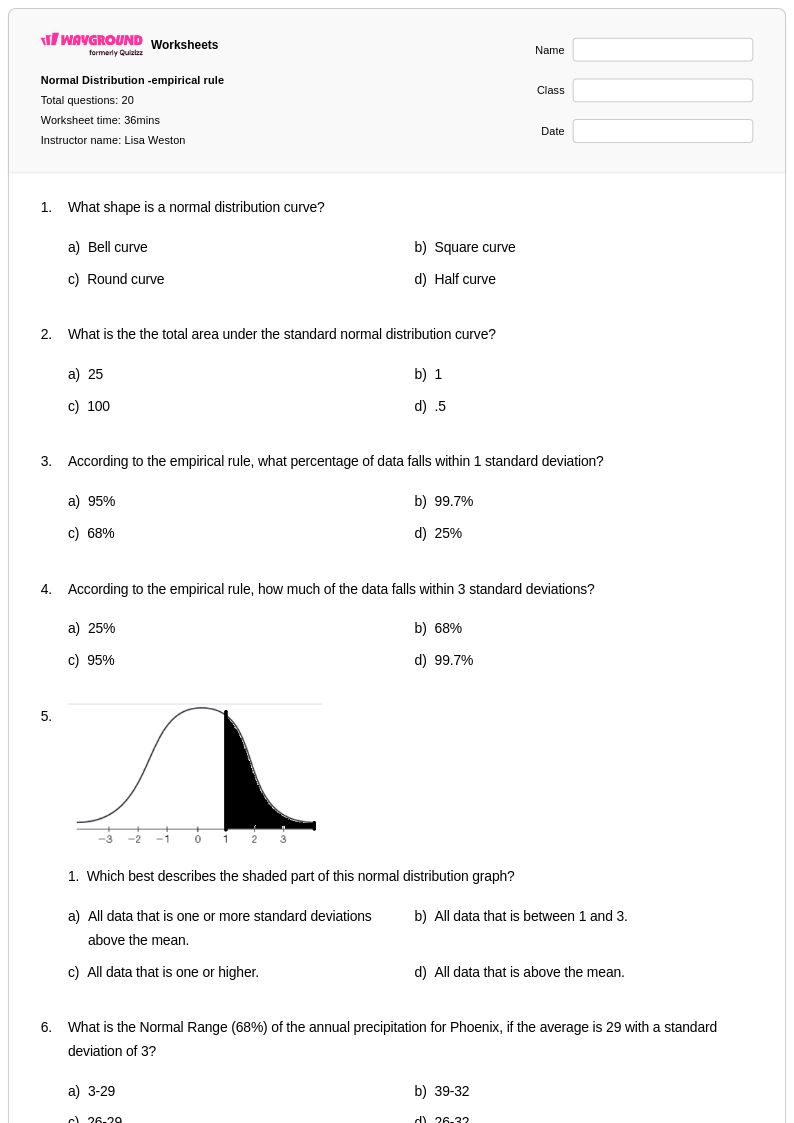
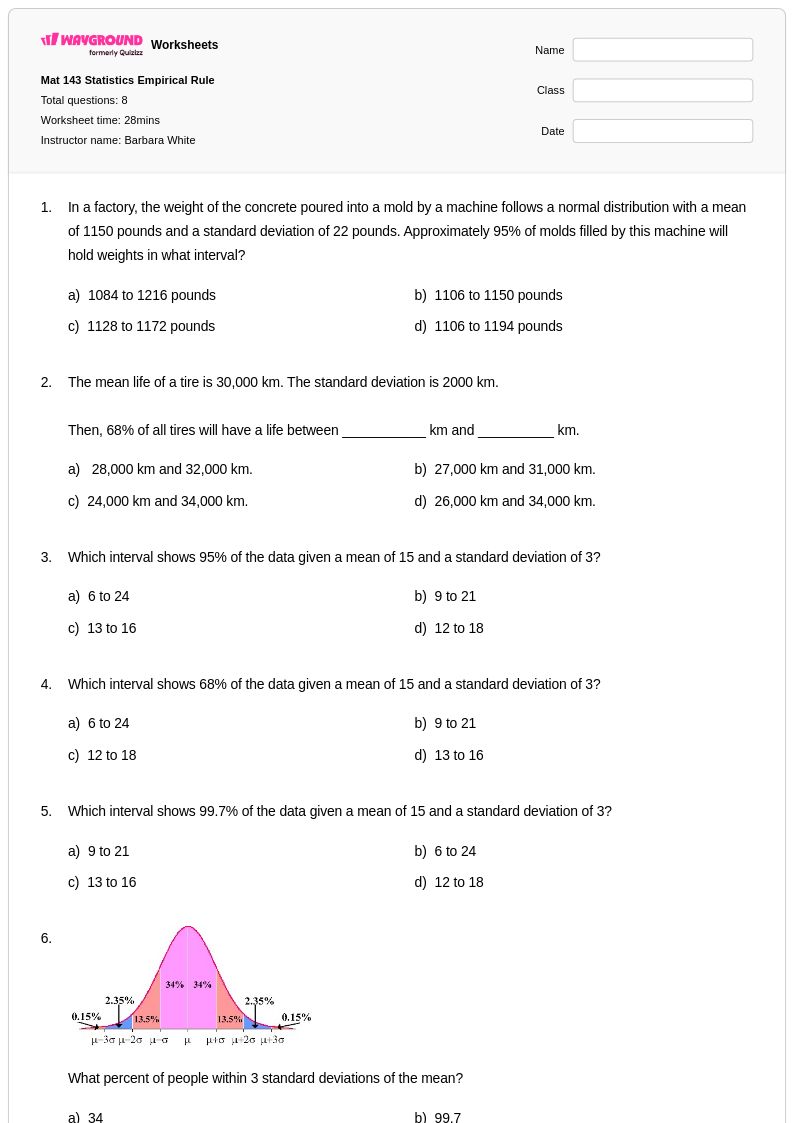
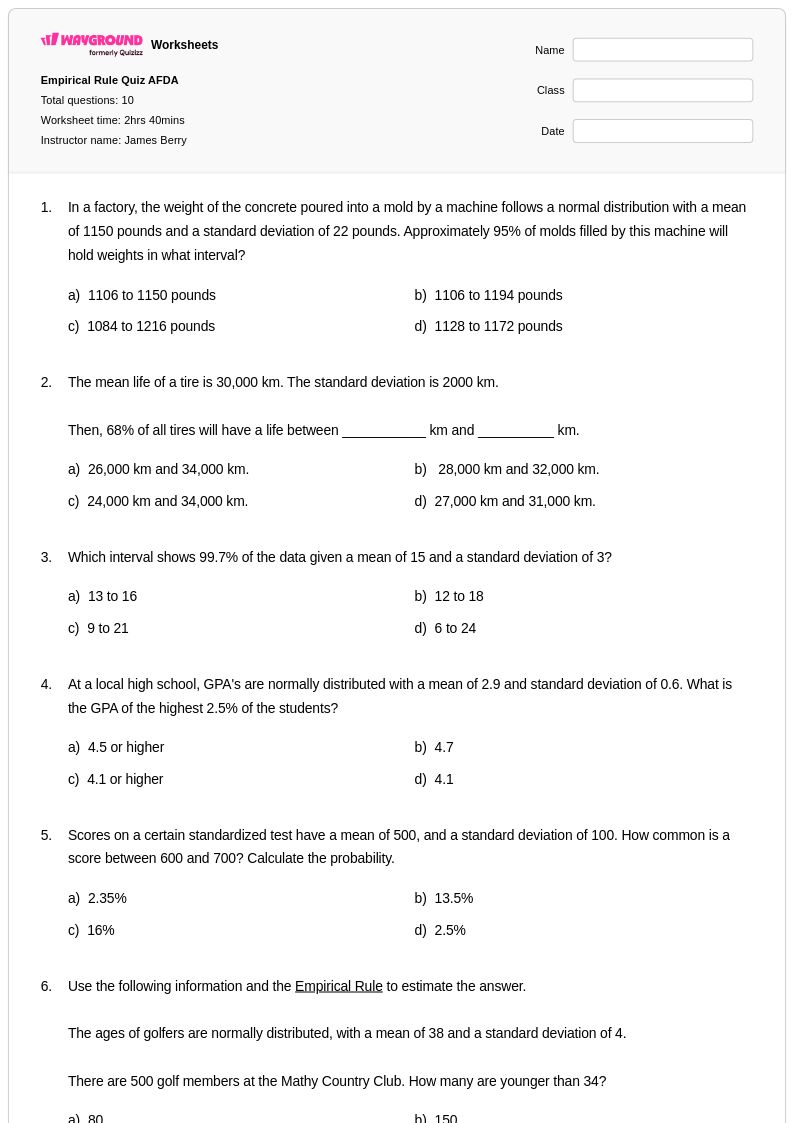
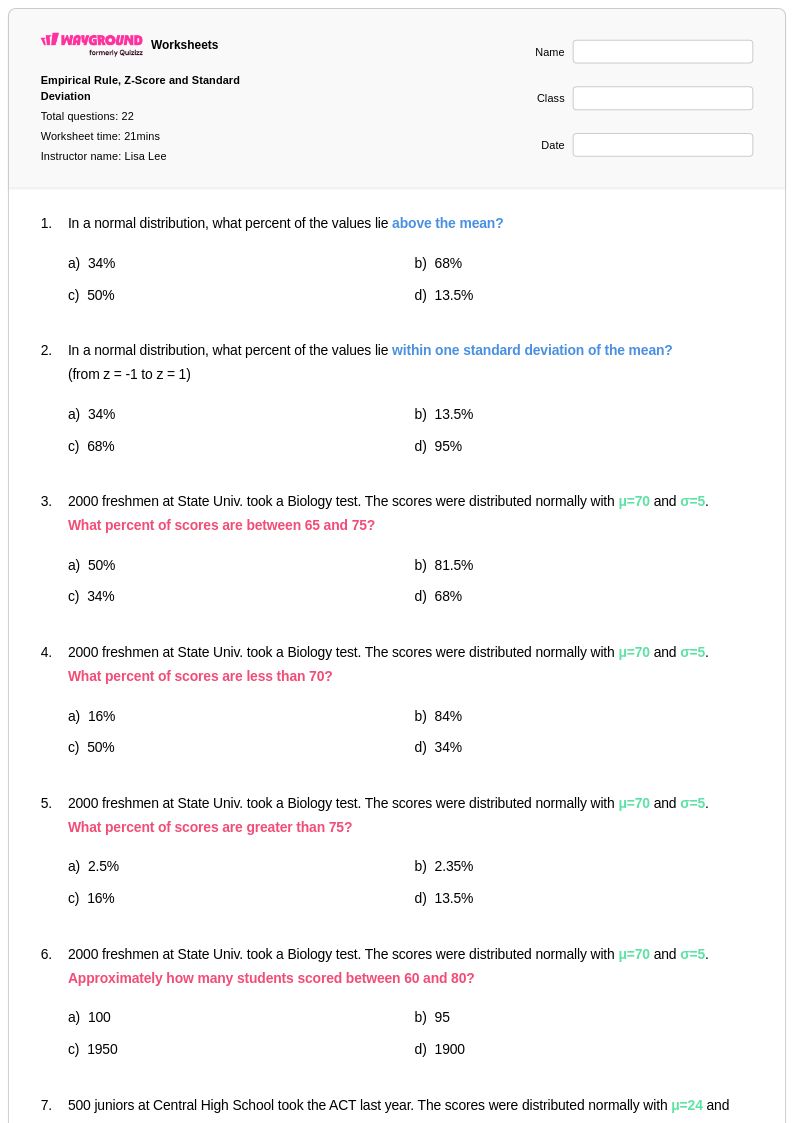
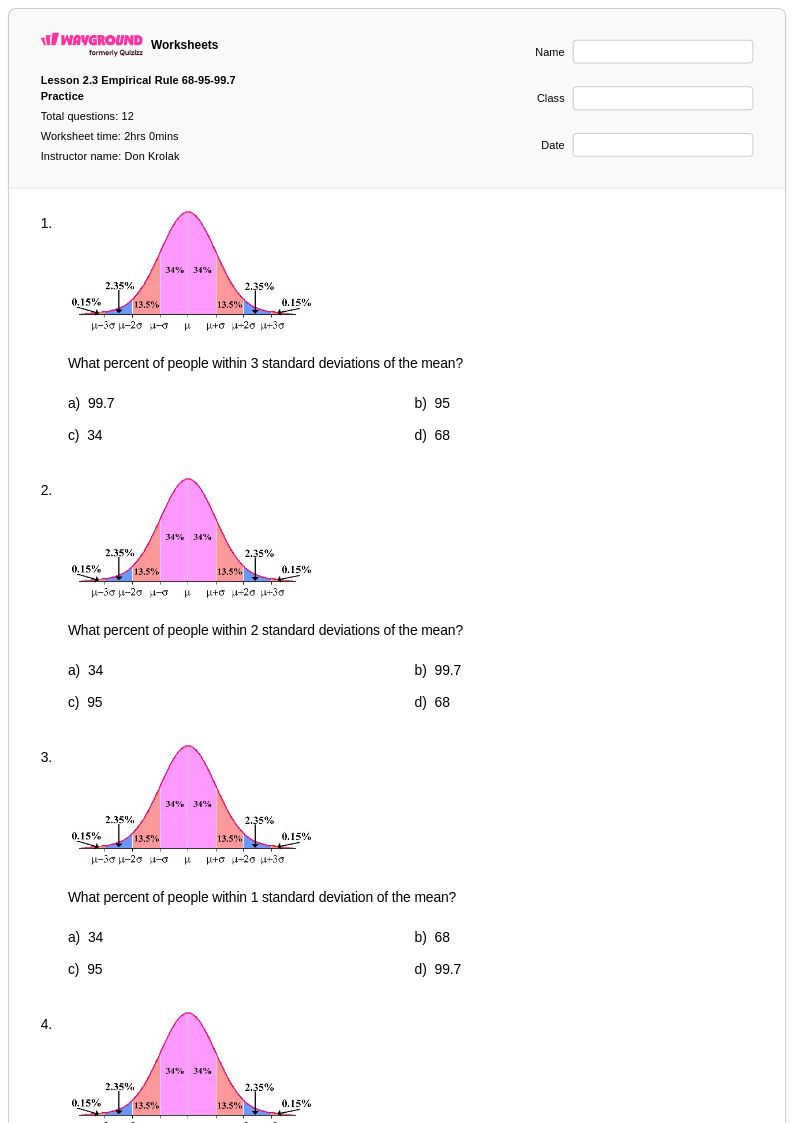
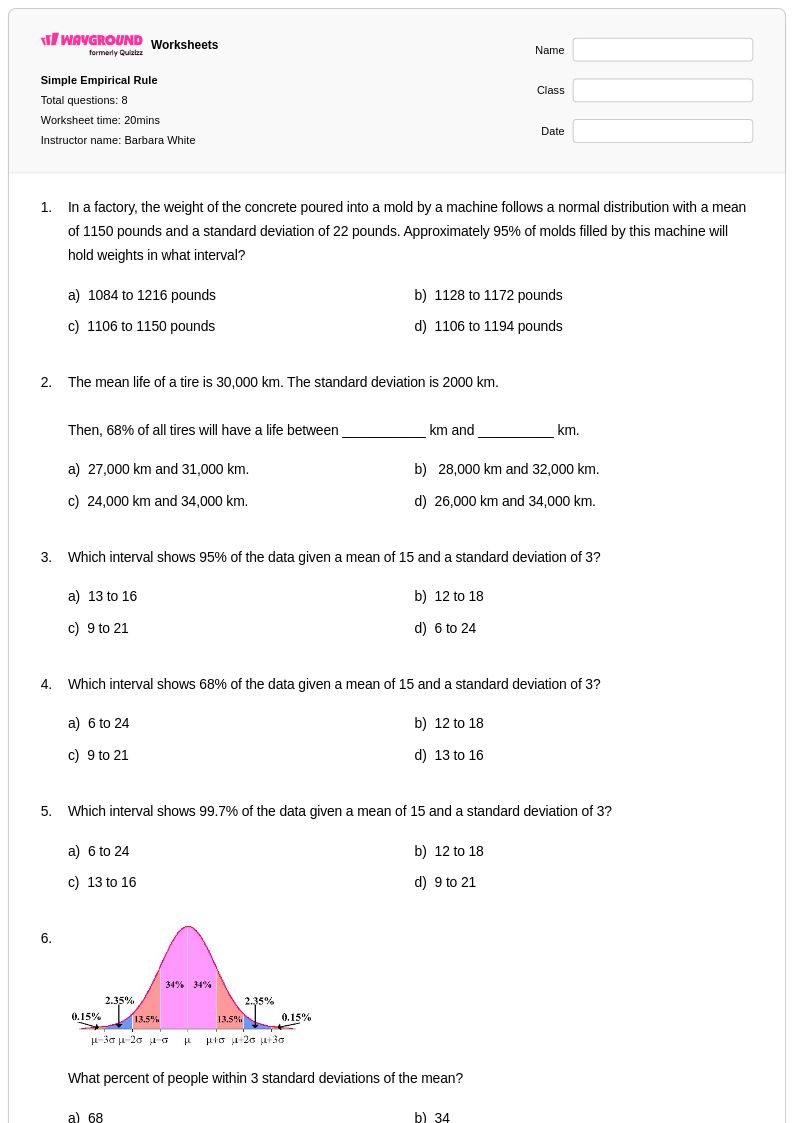
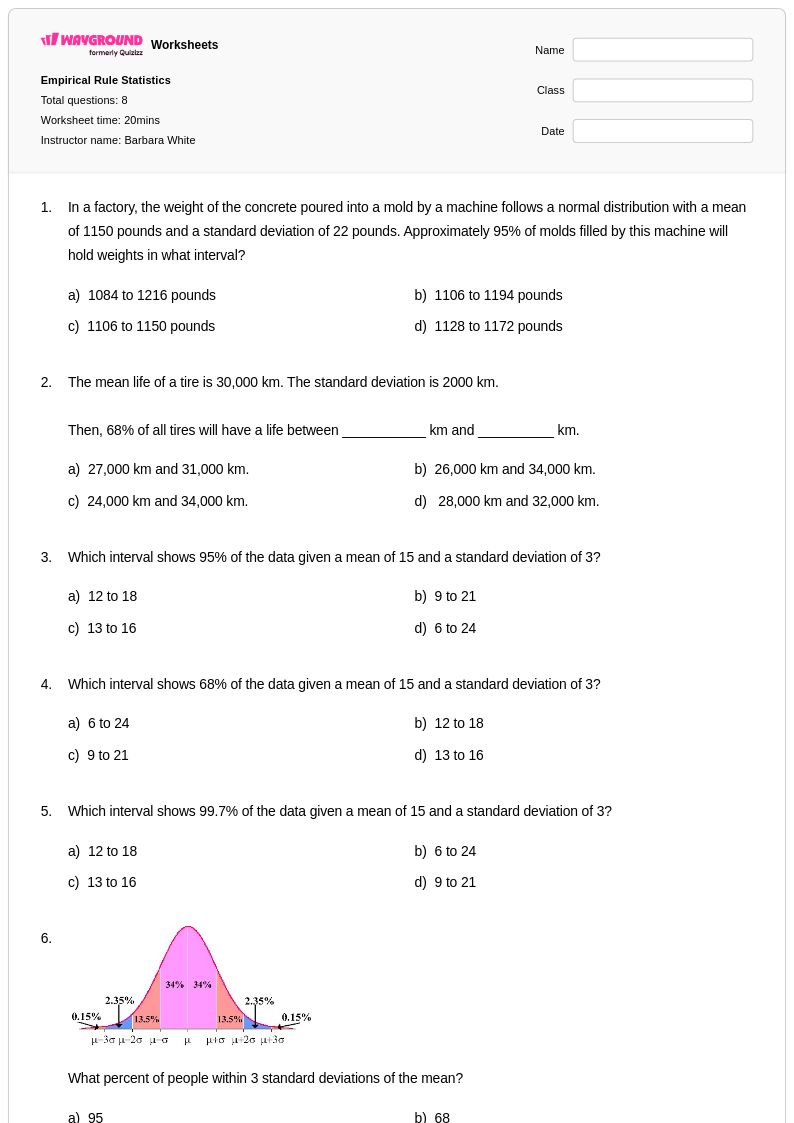
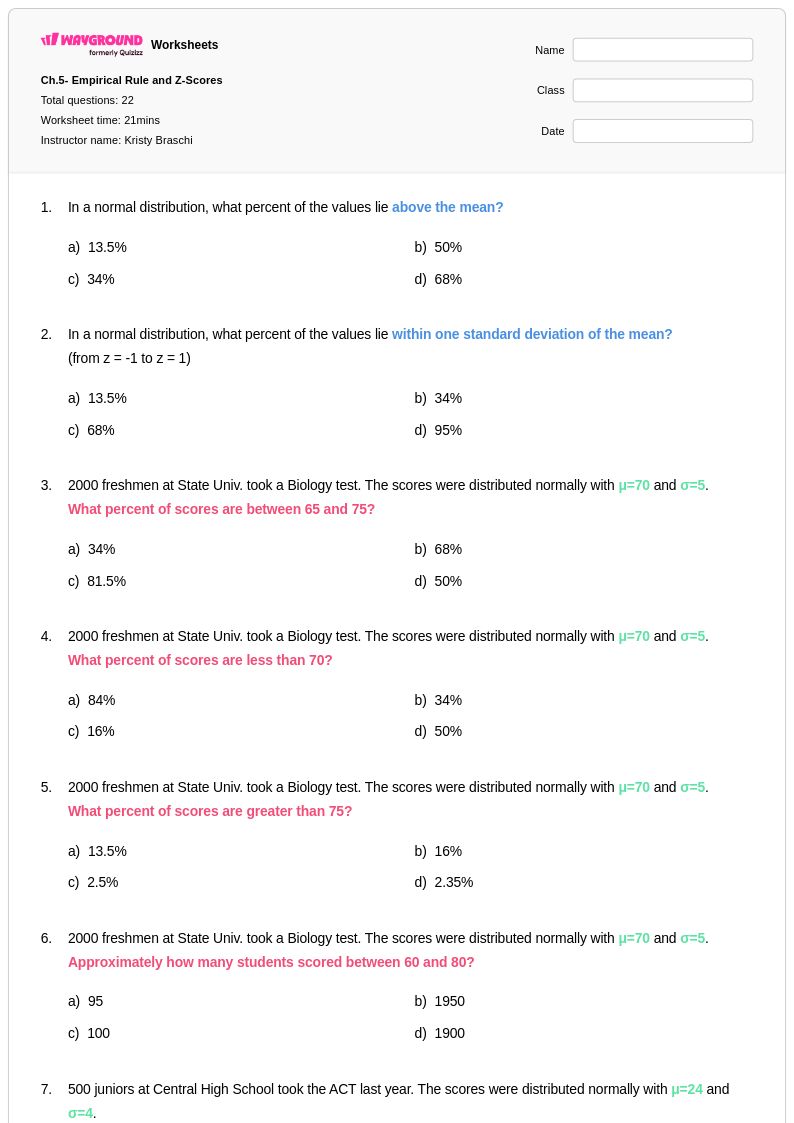
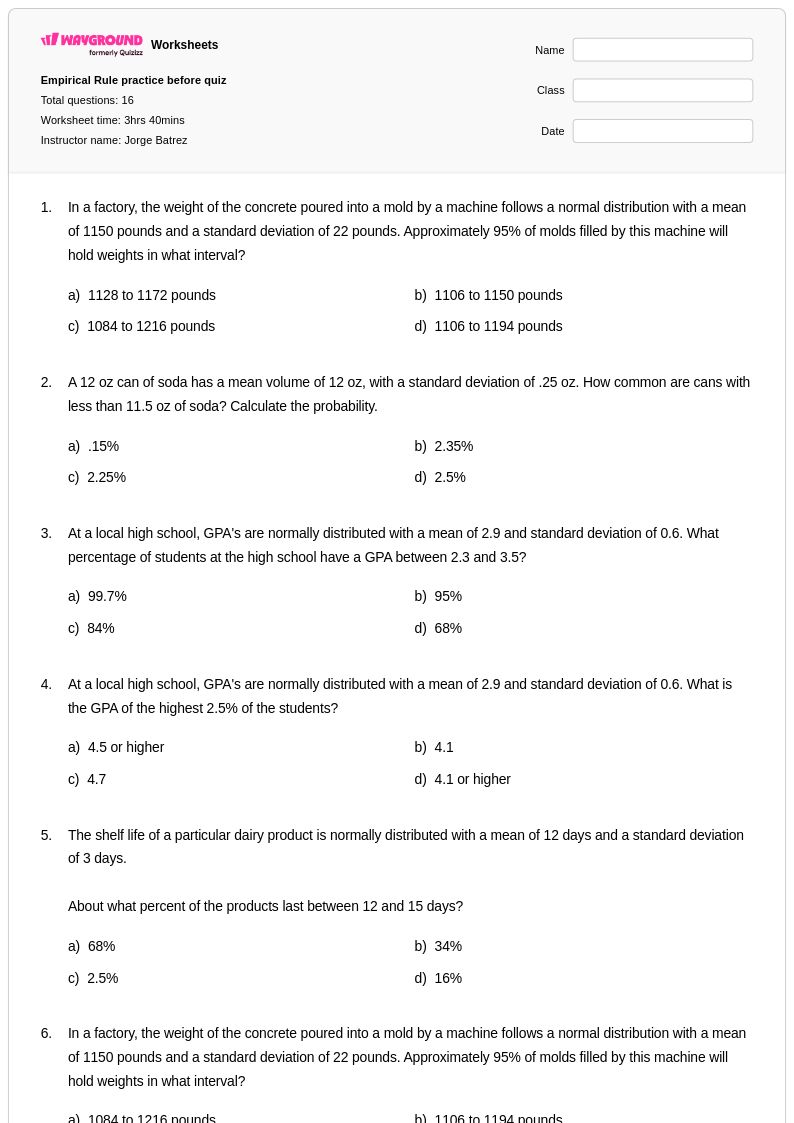
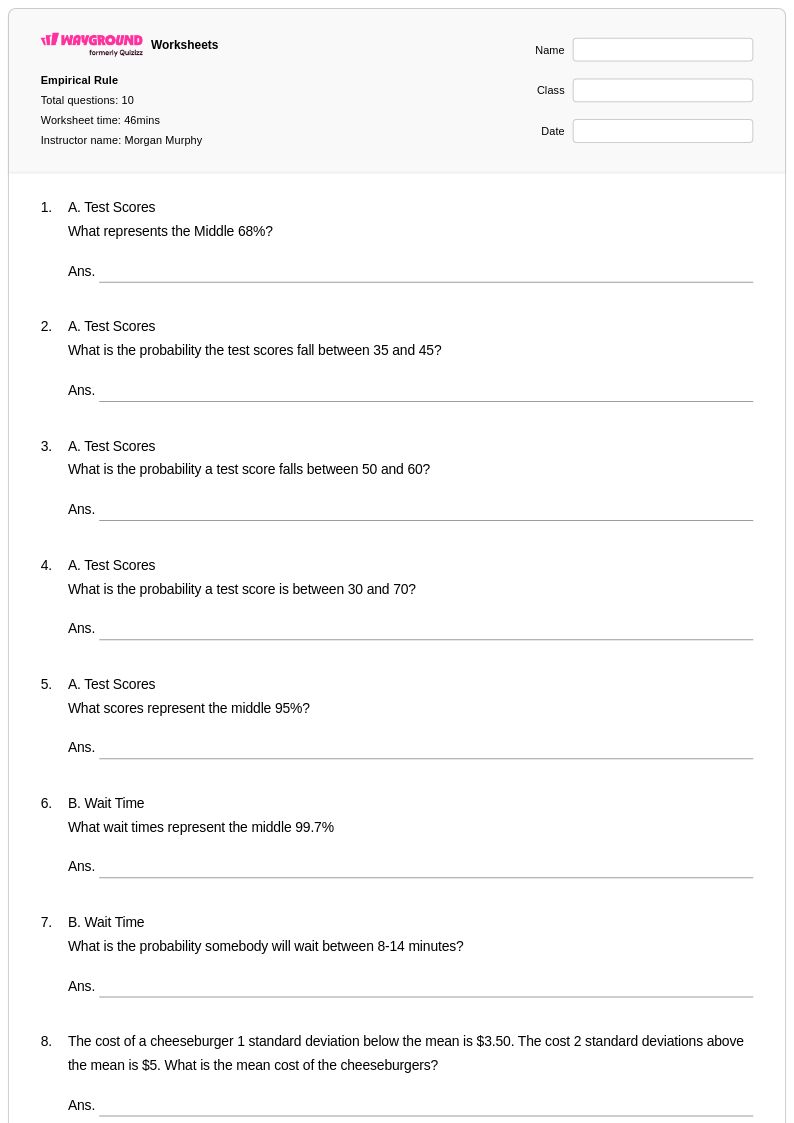
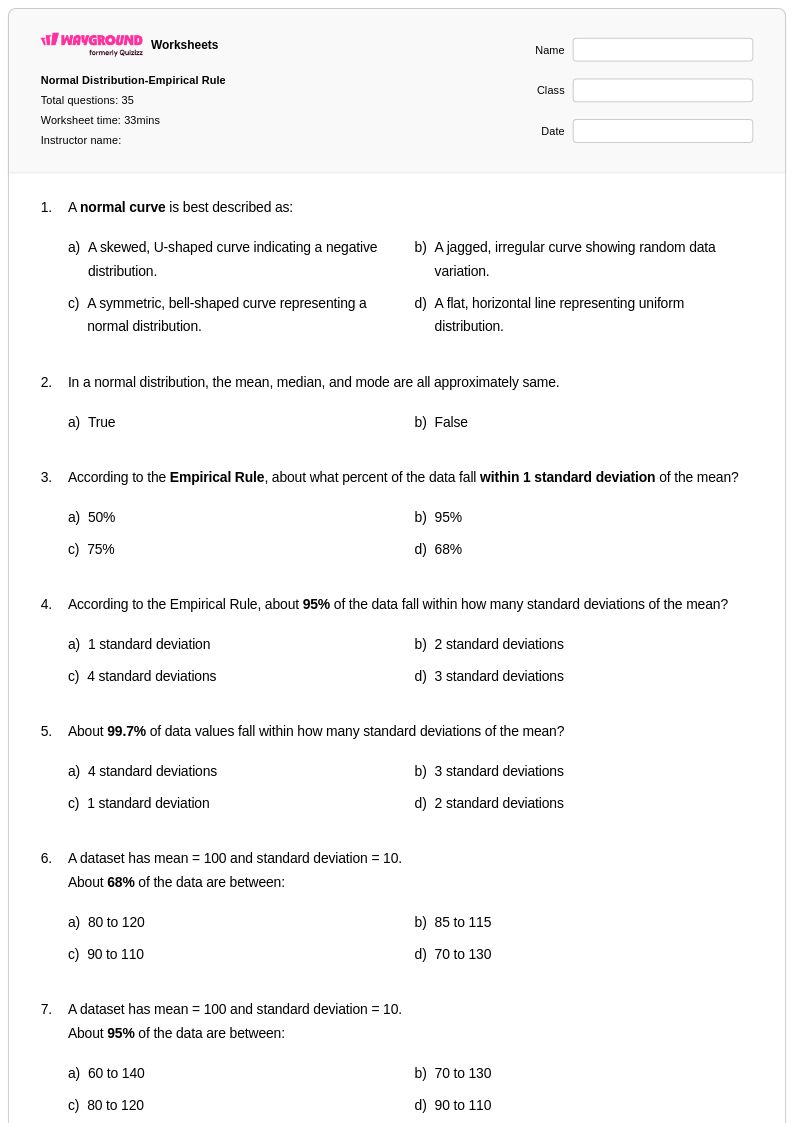
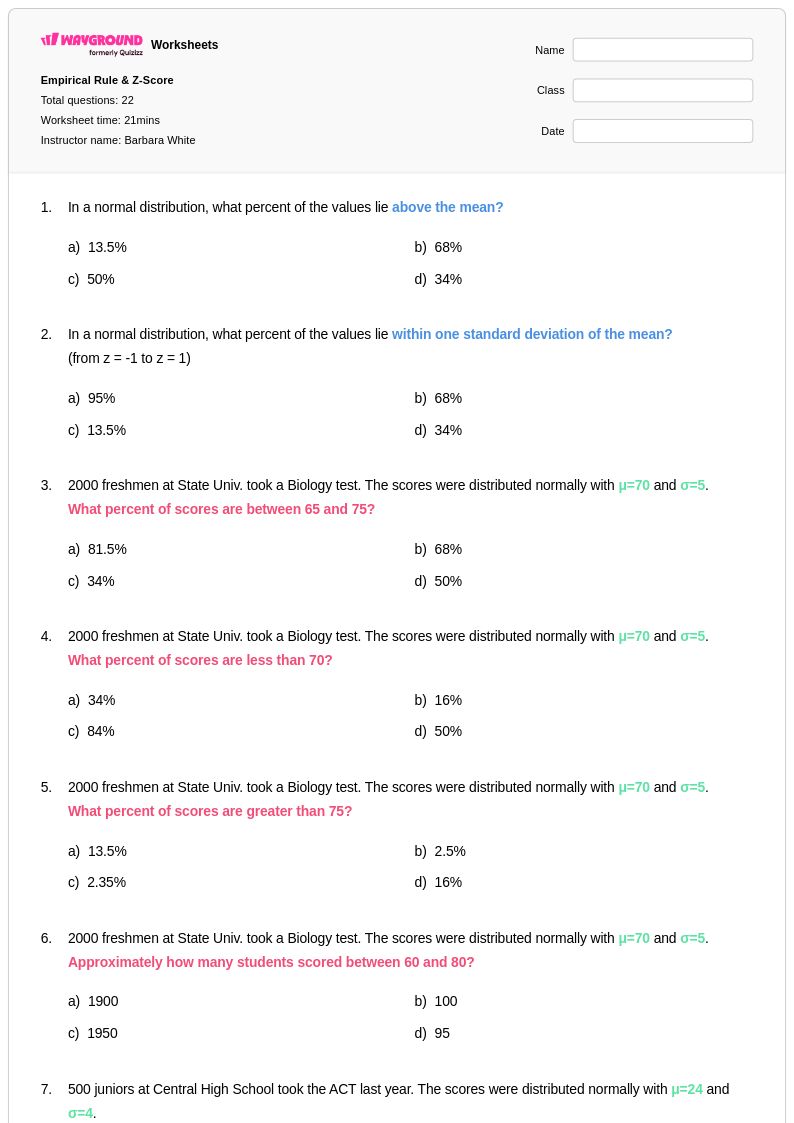
Empirical Rule worksheets for Class 9 students provide essential practice with one of the most fundamental concepts in statistics, helping students understand how data distributes within standard deviations of the mean in a normal distribution. These comprehensive worksheets available through Wayground guide students through calculating percentages of data that fall within one, two, and three standard deviations, strengthening their ability to interpret real-world data sets and make statistical predictions. Students work through practice problems that reinforce the 68-95-99.7 rule, developing proficiency in identifying outliers, analyzing bell curves, and applying statistical reasoning to various contexts. Each worksheet comes with a detailed answer key and is available as a free printable pdf, allowing students to master these critical statistical concepts through repeated practice and self-assessment.
Wayground (formerly Quizizz) empowers educators with millions of teacher-created Empirical Rule resources specifically designed for Class 9 mathematics instruction, featuring robust search and filtering capabilities that help teachers quickly locate materials aligned with their curriculum standards. The platform's differentiation tools enable teachers to customize worksheets based on individual student needs, while flexible formatting options provide both printable pdf versions for traditional classroom use and digital formats for online learning environments. These comprehensive worksheet collections support effective lesson planning by offering varied problem types and difficulty levels, making them invaluable for initial skill introduction, targeted remediation for struggling students, and enrichment activities for advanced learners who need additional statistical reasoning challenges.
FAQs
How do I teach the empirical rule in a 9th grade statistics or algebra class?
By grade 9, students should move past diagram-reading into fluent application. Start by connecting the empirical rule to standard deviation — make sure students understand what standard deviation measures before introducing the 68-95-99.7 percentages, or the rule will feel like a memorization task. Then build toward problems that require students to use the rule to make predictions: if a dataset is normally distributed with a known mean and standard deviation, what percentage of values would you expect above a certain threshold? That predictive framing is what makes the rule useful in real statistics work.
What practice exercises help 9th graders apply the empirical rule fluently?
At grade 9, the most valuable practice combines calculation with interpretation. Students should be able to: determine the data range for each standard deviation interval given a mean and standard deviation, calculate the percentage of a dataset above or below a single boundary (not just within a symmetric interval), and identify likely outliers using the 99.7% threshold. Wayground's grade 9 worksheets include real-world contexts — test scores, population measurements, quality control — that give these calculations a purpose beyond the worksheet itself.
What misconceptions do 9th graders still have about the empirical rule?
Even at grade 9, two misconceptions persist. First, students apply the rule to non-normal distributions — they'll use 68-95-99.7 on a clearly skewed dataset without checking whether the normal distribution assumption holds. Second, they treat the rule as exact rather than approximate, which causes confusion when a problem involves a dataset that's close but not perfectly normal. Both are worth addressing directly: show a skewed distribution and ask whether the empirical rule applies, and discuss why 'approximately 68%' is the correct language.
How do I use Wayground's grade 9 empirical rule worksheets?
These worksheets can be hosted as a digital quiz on Wayground — useful for formative checks where you want to see which students are misapplying the rule before moving on — or printed as PDFs for paper-based practice or assessments. Each worksheet includes a complete answer key. For printed submissions, the Wayground for Teachers app lets you scan and grade student work without entering scores manually.
How does the empirical rule fit into the Common Core high school statistics progression?
Common Core's high school statistics strand expects students to use the mean and standard deviation of a normally distributed dataset to estimate population percentages, and the empirical rule is the entry point for that work. At grade 9, students are typically building from earlier work on distributions and variability toward z-scores and formal probability calculations. The empirical rule sits in the middle of that progression: it's more precise than saying 'most data is near the mean' but more accessible than z-score tables, making it the right tool for introducing normal distribution reasoning before students are ready for the full standard normal model.
How can I support diverse learners in my 9th grade class with empirical rule practice?
For students who need more time on multi-step problems — particularly those involving tail calculations — Wayground's per-student extended time setting on digital assignments is the most direct accommodation. For English language learners working through word problems that describe real-world scenarios, Wayground's worksheet translation tool can render the same problems in a student's home language without changing the mathematical content. Both accommodations are invisible to other students and carry over to future sessions once set.