
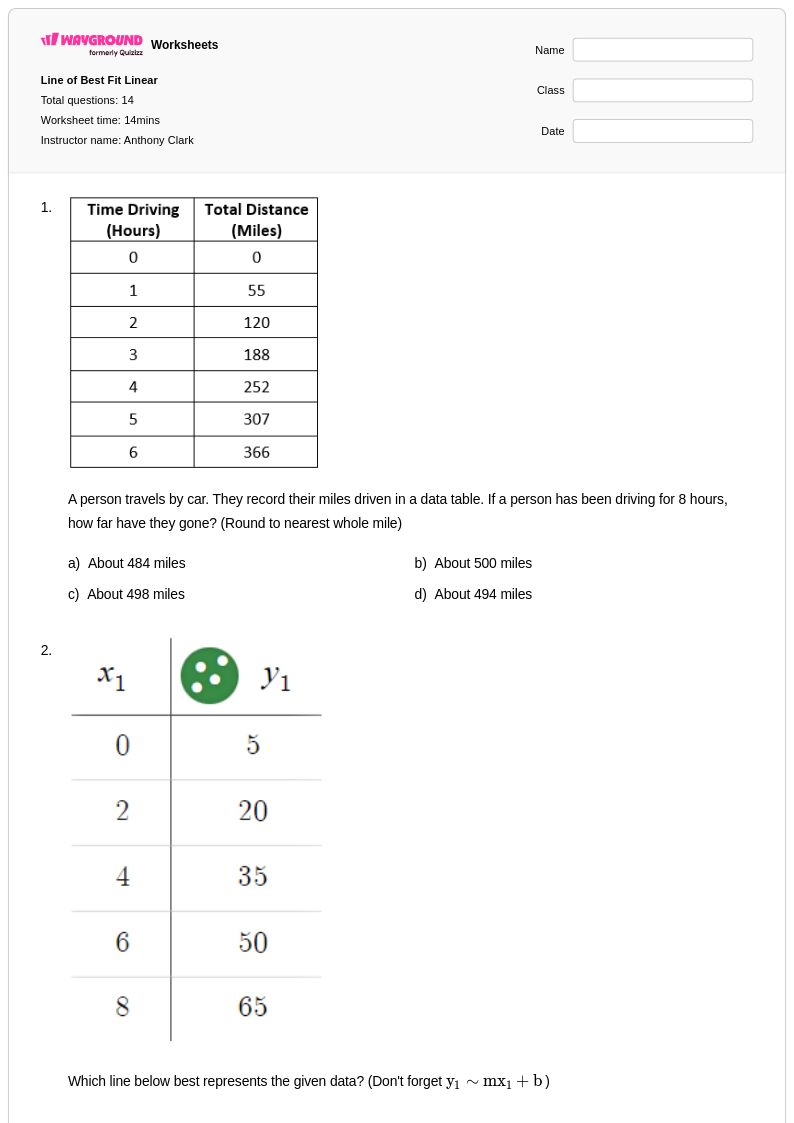
14 Q
9th - Uni
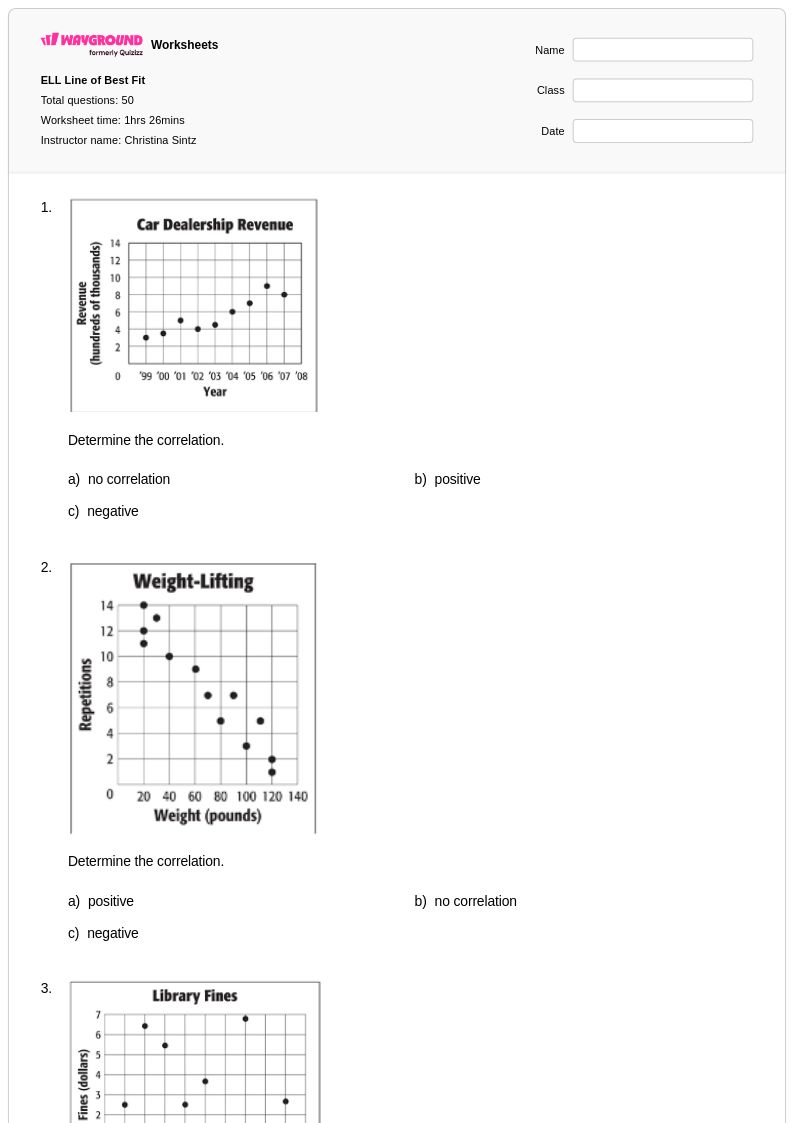
50 Q
9th
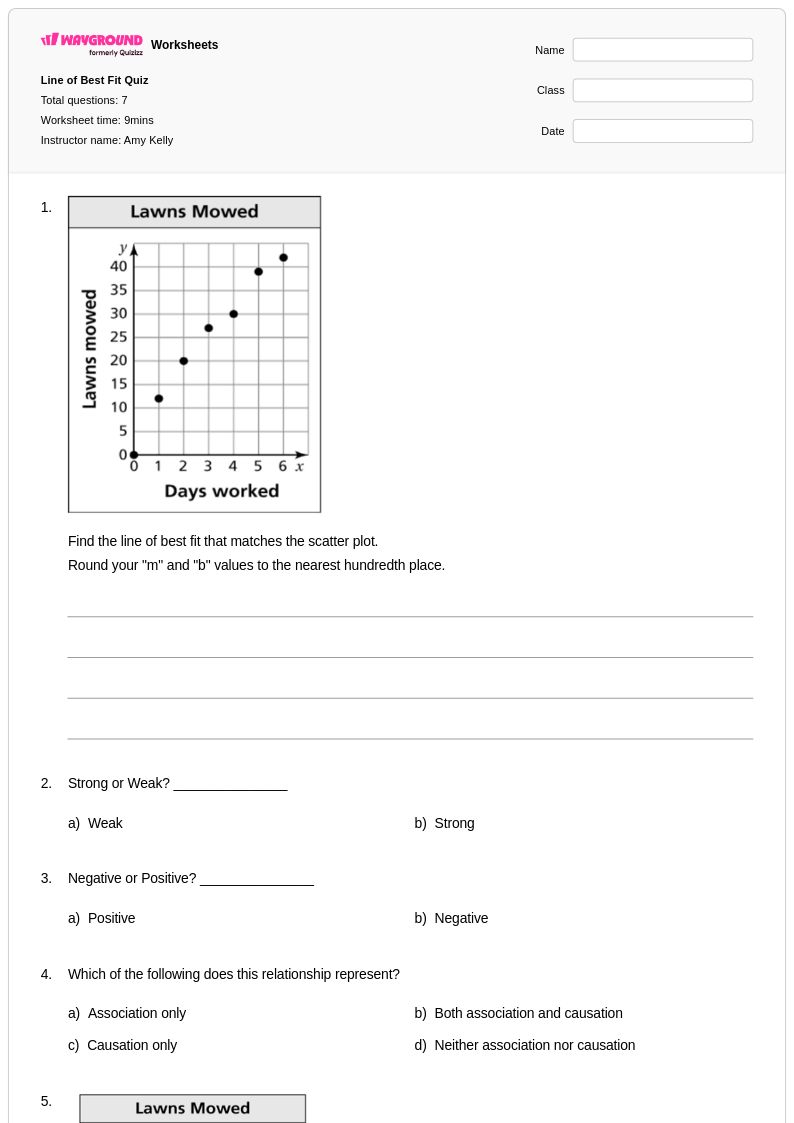
7 Q
9th
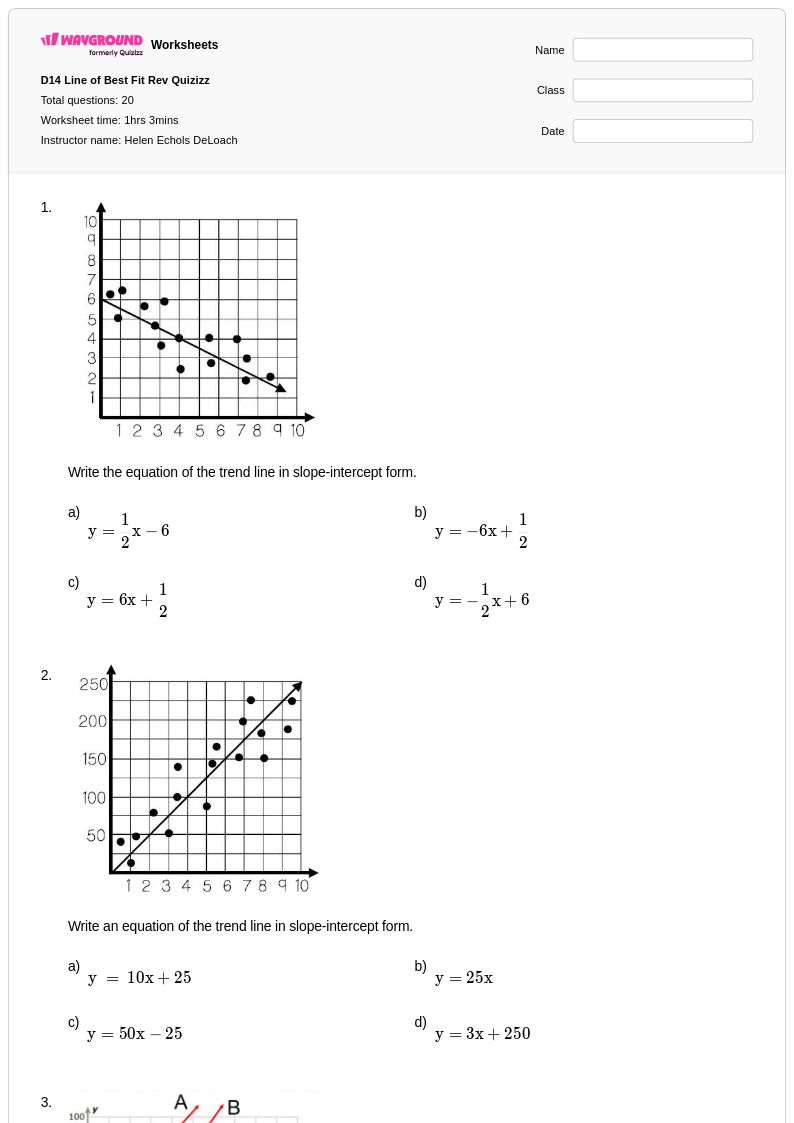
20 Q
9th
20 Q
8th - Uni
20 Q
9th - Uni
20 Q
9th - Uni
20 Q
8th - Uni
20 Q
8th - Uni
15 Q
8th - Uni
20 Q
8th - Uni
20 Q
8th - Uni
20 Q
8th - Uni
20 Q
8th - Uni
9 Q
9th - Uni
20 Q
8th - Uni
15 Q
8th - Uni
20 Q
8th - Uni
20 Q
9th - Uni
15 Q
8th - Uni
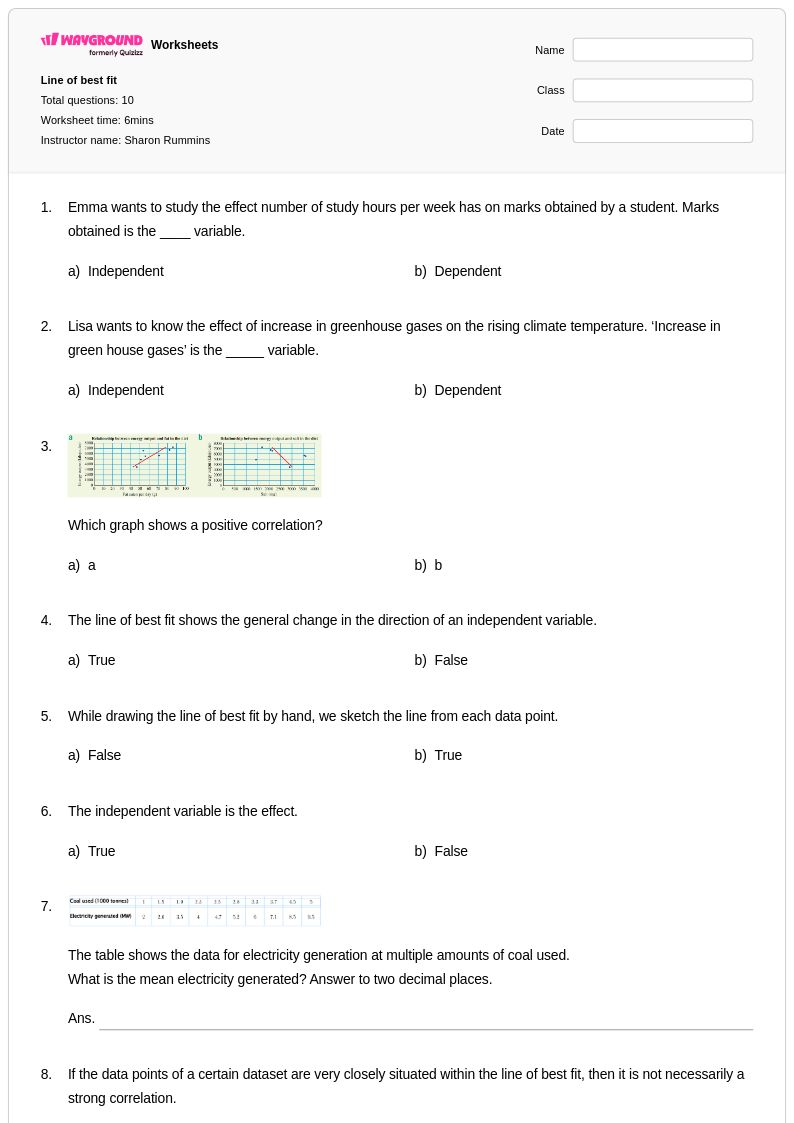
10 Q
8th - 12th
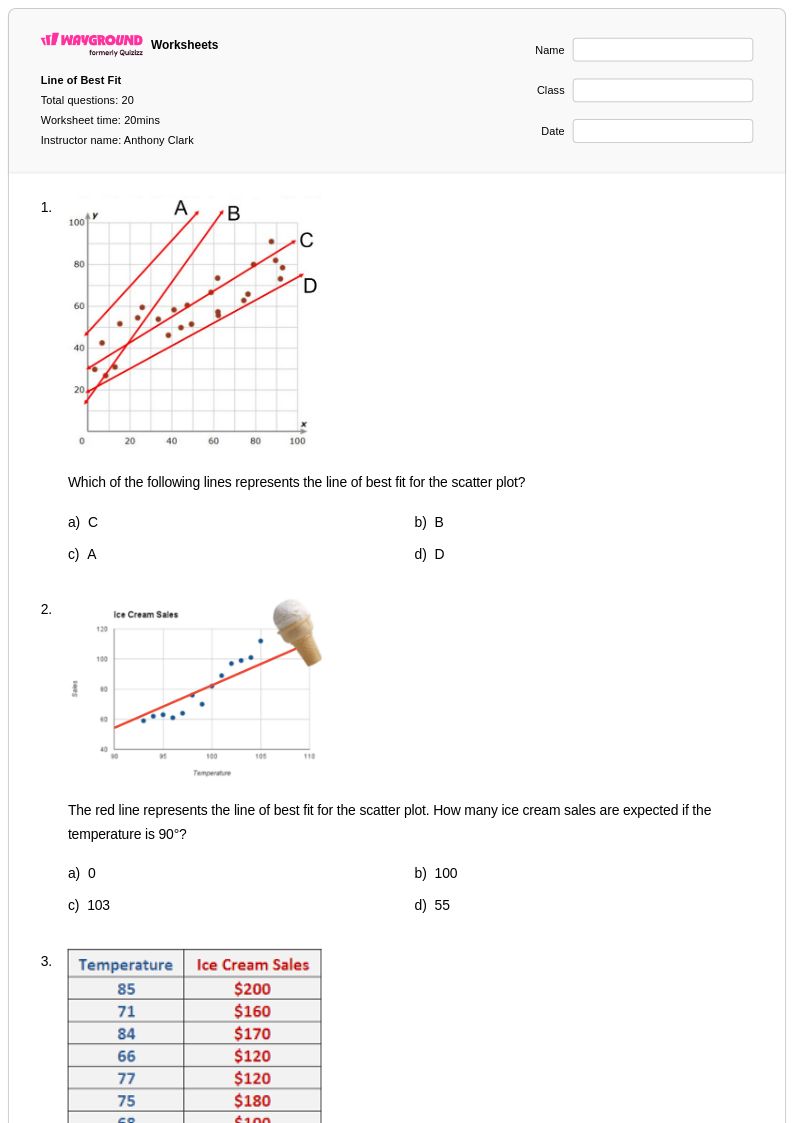
20 Q
8th - Uni
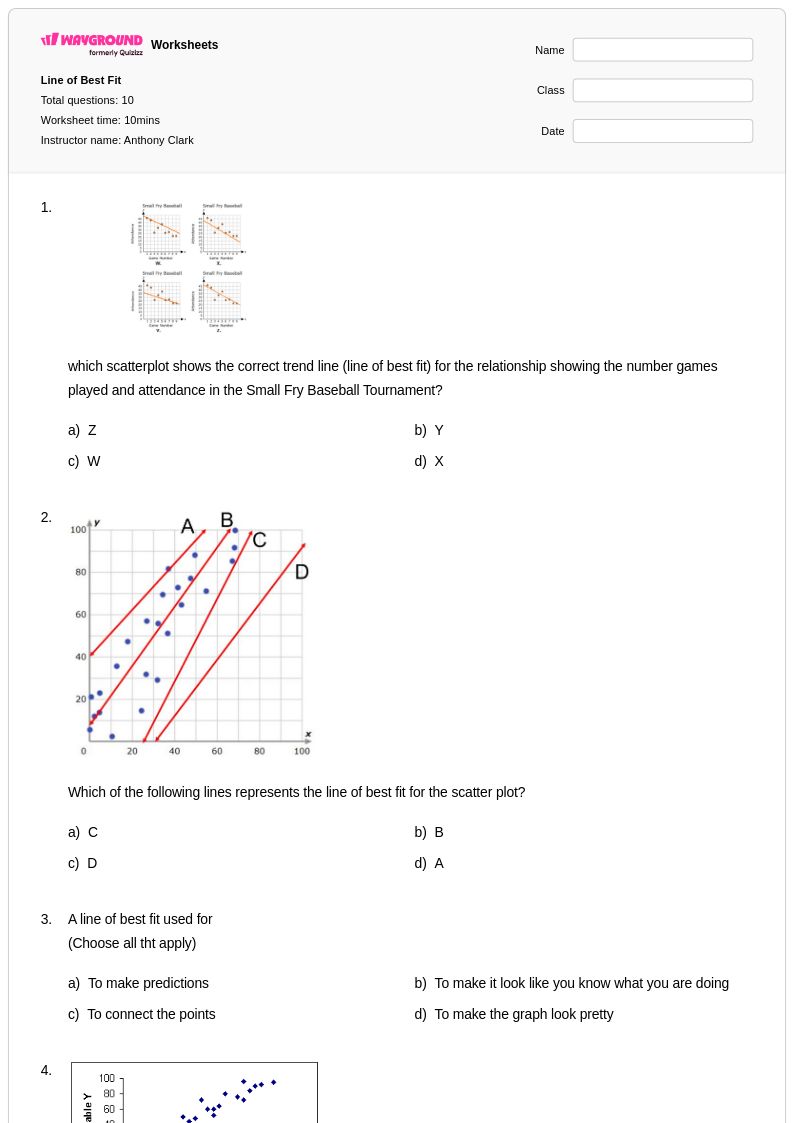
10 Q
8th - Uni
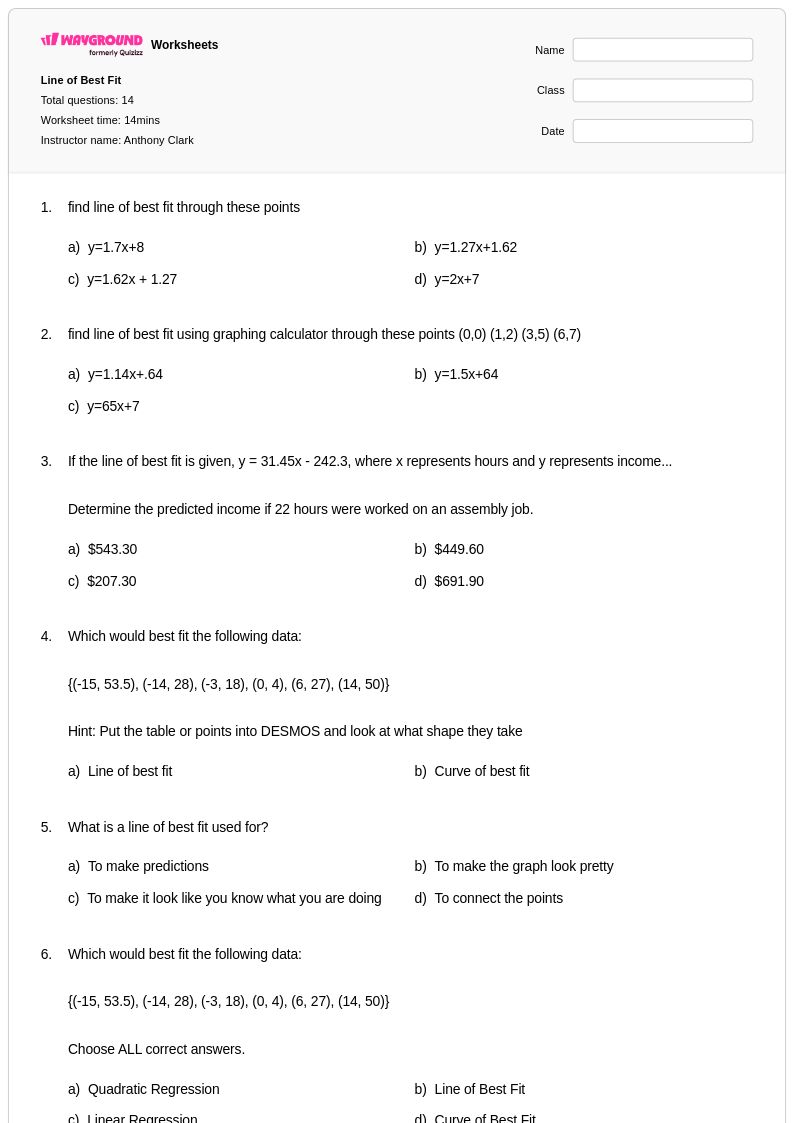
14 Q
8th - Uni
Explore Other Subject Worksheets for class 9
Explore printable Line of Best Fit worksheets for Class 9
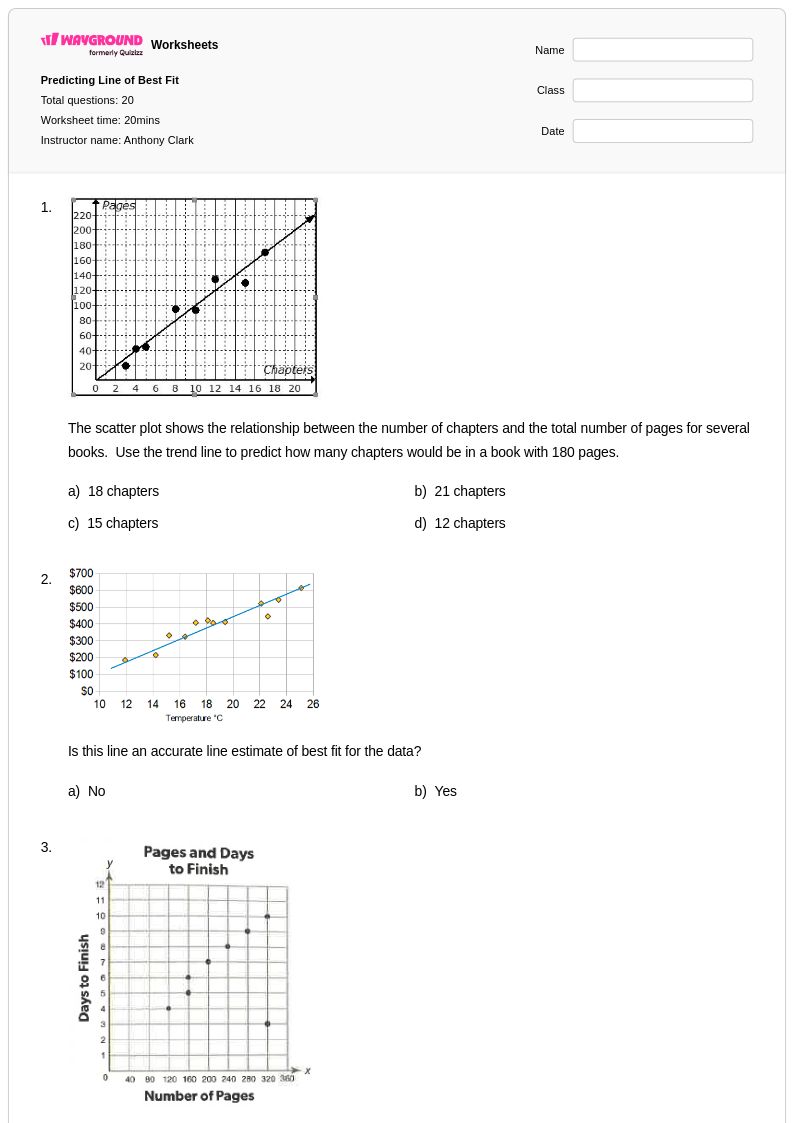
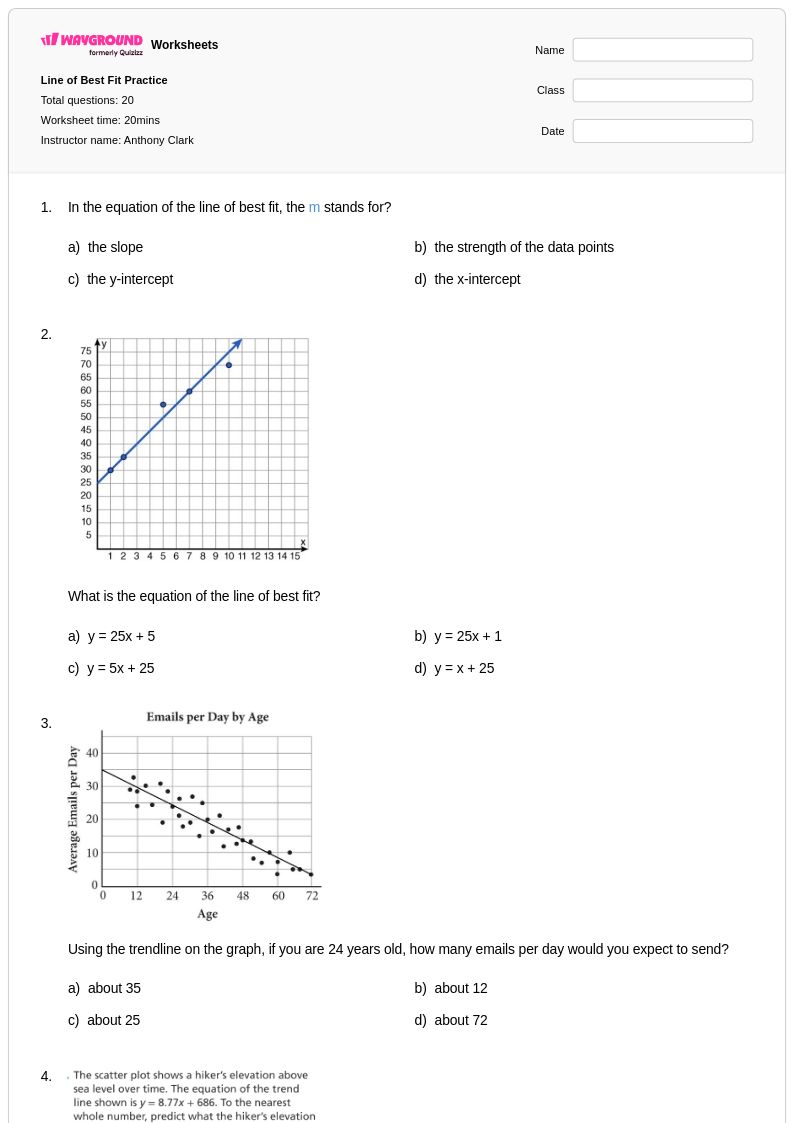
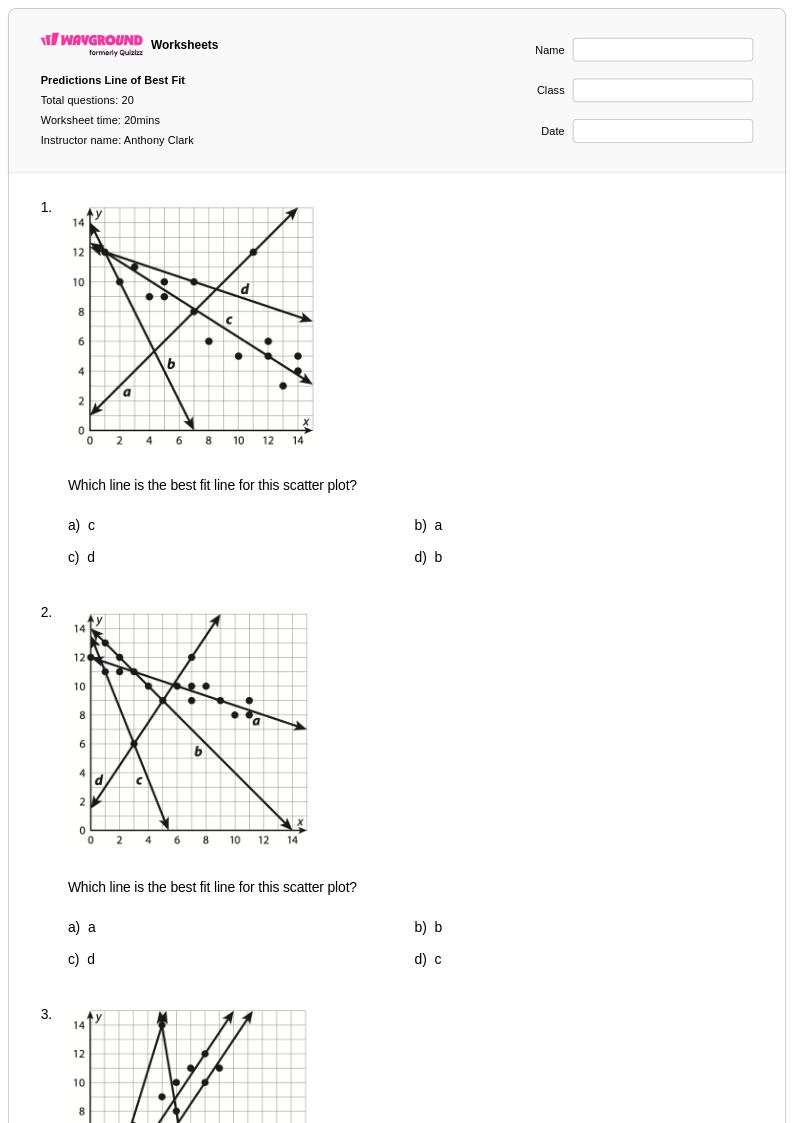
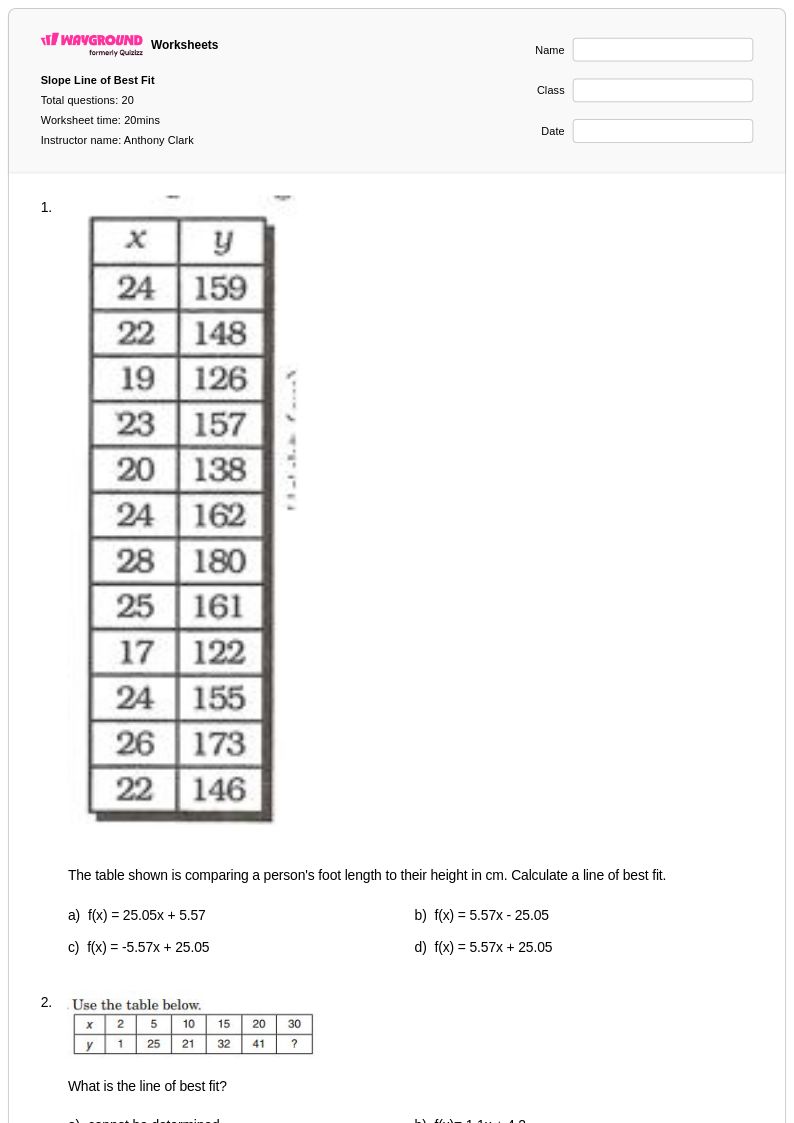
Line of best fit worksheets for Class 9 mathematics provide essential practice in analyzing scatter plots and determining linear relationships between variables. These comprehensive resources from Wayground (formerly Quizizz) help students develop critical skills in interpreting data patterns, calculating correlation coefficients, and drawing accurate trend lines through data points. Students work through practice problems that require them to identify positive, negative, and no correlation scenarios while learning to make predictions based on their linear models. Each worksheet includes detailed answer keys that guide students through the step-by-step process of finding the line of best fit using various methods, including visual estimation and least squares regression. These free printables cover real-world applications such as analyzing sales trends, population growth, and scientific data, ensuring students understand the practical relevance of statistical analysis in their academic and future professional endeavors.
Wayground (formerly Quizizz) supports mathematics educators with millions of teacher-created line of best fit worksheets specifically designed for Class 9 probability and statistics instruction. The platform's robust search and filtering system allows teachers to quickly locate resources that align with curriculum standards and match their students' specific learning needs. Teachers can customize these worksheets to provide differentiated instruction, adjusting complexity levels for remediation or enrichment purposes while maintaining focus on essential statistical concepts. Available in both printable pdf format and interactive digital versions, these resources seamlessly integrate into various teaching environments and learning management systems. The extensive collection enables educators to efficiently plan lesson sequences, provide targeted skill practice, and assess student understanding of correlation analysis and linear modeling concepts throughout their statistics units.
FAQs
How does the line of best fit topic advance in Grade 9?
How do I connect the visual line of best fit to its algebraic equation?
What advanced skills do these Grade 9 worksheets cover?
What are common mistakes when interpreting slope and y-intercept?
How can I use this Wayground worksheet with my 9th graders?
How does this topic align with high school math standards?
How can I differentiate this topic for students who struggle with algebra?