Free Printable Rain Shadow Effect Worksheets for Class 10
Explore Class 10 rain shadow effect worksheets and printables that help students understand how mountains create dry regions by blocking moisture, featuring practice problems and answer keys for comprehensive Earth science learning.
Explore printable Rain Shadow Effect worksheets for Class 10
Rain shadow effect worksheets for Class 10 students available through Wayground provide comprehensive resources for understanding this fundamental atmospheric phenomenon in Earth and space science. These expertly designed materials guide students through the complex processes that occur when air masses encounter mountain barriers, including orographic lifting, adiabatic cooling, precipitation patterns, and the creation of distinct wet and dry zones on opposite sides of mountain ranges. The worksheets strengthen critical thinking skills through practice problems that require students to analyze topographic maps, interpret precipitation data, and predict weather patterns based on geographic features. Complete answer keys accompany these free printable resources, enabling both independent study and classroom instruction while ensuring students can verify their understanding of concepts such as windward versus leeward slopes, rain shadow deserts, and regional climate variations.
Wayground (formerly Quizizz) empowers educators with an extensive collection of millions of teacher-created resources specifically designed for rain shadow effect instruction at the Class 10 level. The platform's robust search and filtering capabilities allow teachers to quickly locate materials that align with curriculum standards and match their specific instructional needs, whether focusing on basic conceptual understanding or advanced meteorological applications. These versatile worksheet collections support differentiated instruction through customizable difficulty levels and can be seamlessly integrated into lesson planning for both remediation and enrichment purposes. Available in both printable pdf format and interactive digital versions, these resources facilitate flexible classroom implementation while providing teachers with reliable tools for skill practice, formative assessment, and reinforcement of essential Earth and space science concepts related to orographic effects and regional climate patterns.
FAQs
How do I teach the rain shadow effect to middle or high school students?
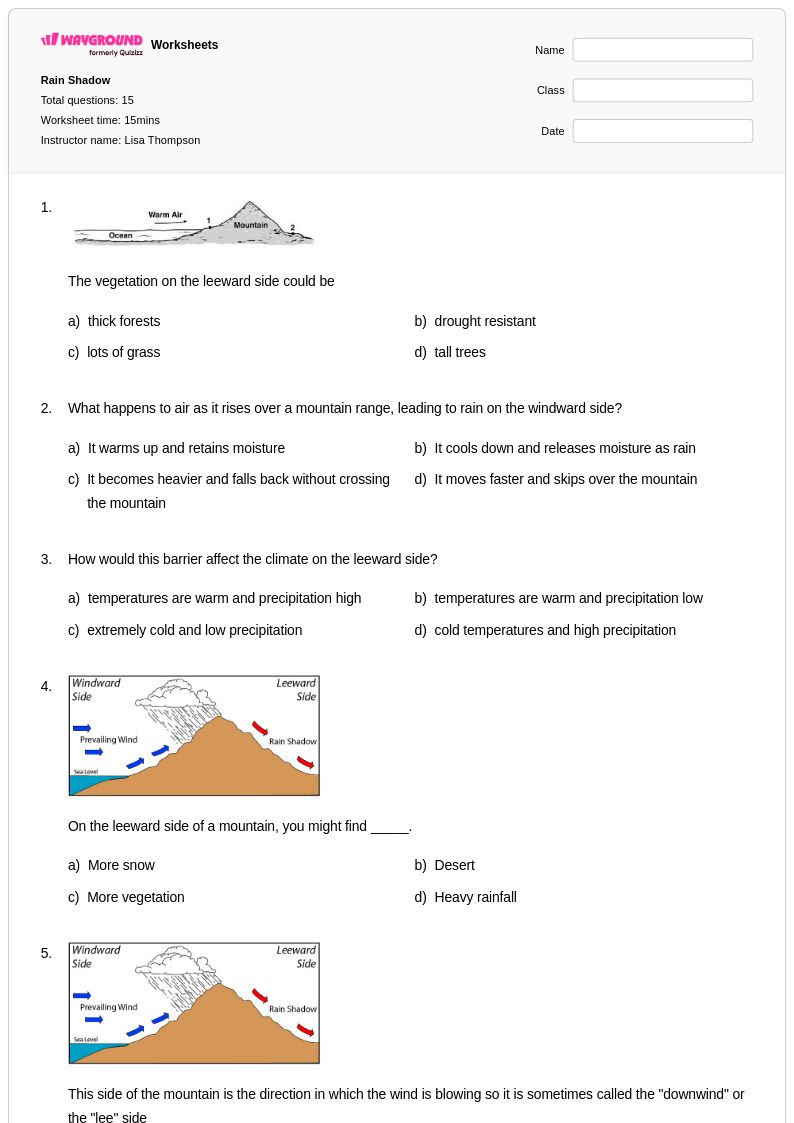
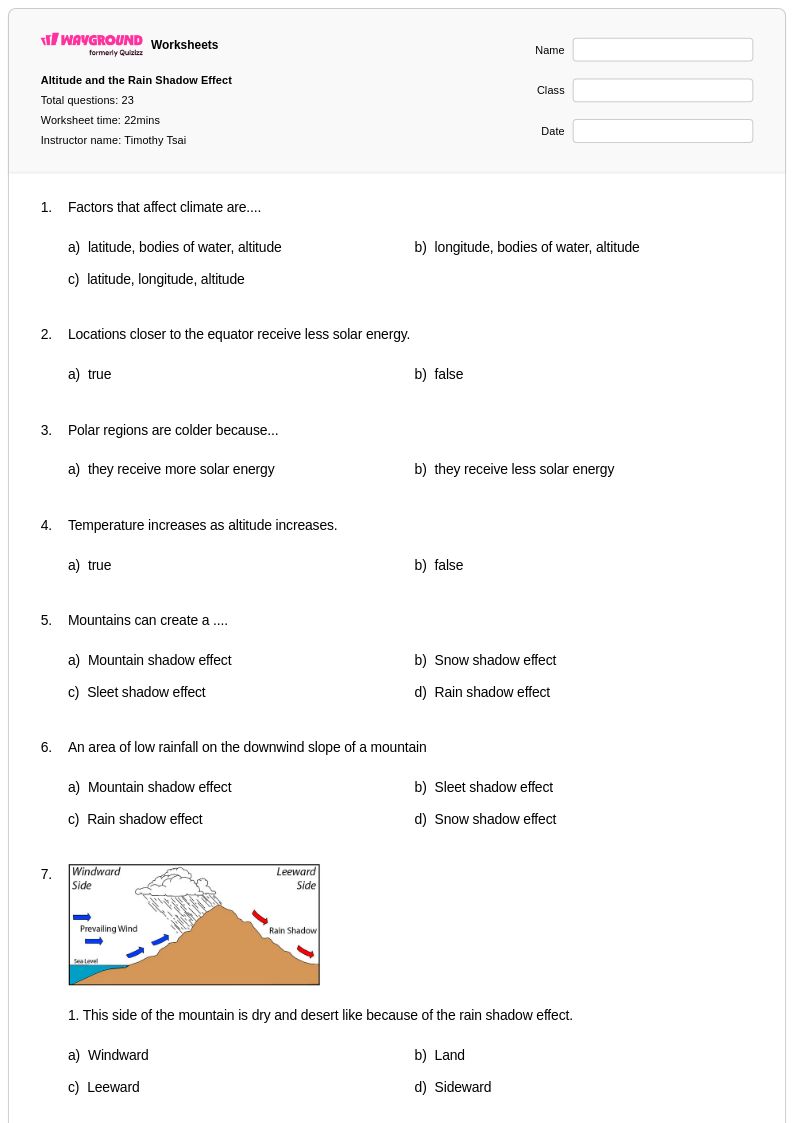
Start by grounding students in the orographic lift process: as moist air is forced up a mountain's windward side, it cools, condenses, and releases precipitation, then descends on the leeward side as dry, warm air. Using real-world examples like the Sierra Nevada and Cascade Range makes the concept concrete and memorable. Pairing elevation profile diagrams with precipitation data lets students see the pattern rather than just memorize it. A brief class discussion comparing the windward and leeward climates of a specific mountain range helps solidify the contrast before students move to independent practice.
What exercises help students practice understanding the rain shadow effect?
Effective practice exercises include analyzing elevation profiles alongside precipitation maps to identify windward and leeward sides, labeling diagrams of orographic lift and adiabatic cooling, and interpreting real precipitation data from mountain regions like the Rocky Mountains or Cascades. Problems that ask students to predict which side of a mountain will be wetter, and why, build both conceptual understanding and data literacy. Worksheets that incorporate weather map reading add an applied layer that connects atmospheric science to geographic analysis.
What misconceptions do students commonly have about the rain shadow effect?
A frequent misconception is that mountains simply block rain rather than actively triggering precipitation through orographic lift and adiabatic cooling. Students also tend to conflate the windward side being wet with it being the side facing the prevailing wind, not always understanding why prevailing wind direction determines which side receives moisture. Another common error is assuming the leeward side is always a desert, when in reality the degree of aridity depends on factors like elevation, distance, and the moisture content of the original air mass.
How do I use rain shadow effect worksheets in my classroom?
Rain shadow effect worksheets on Wayground are available as printable PDFs for traditional classroom use and in digital formats for technology-integrated environments, so they work whether students are at desks or on devices. Teachers can also host worksheets as a quiz directly on Wayground, which allows for immediate feedback and easy progress tracking. Each worksheet includes a complete answer key, making them efficient tools for guided practice, independent work, or formative assessment without requiring additional prep time.
How does the rain shadow effect connect to broader Earth science standards?
The rain shadow effect sits at the intersection of several core Earth science concepts, including atmospheric processes, topography, climate systems, and the water cycle, making it highly relevant to NGSS and state-level Earth and space science standards. Teaching it gives students a concrete, visual case study for abstract processes like adiabatic lapse rates and condensation. It also provides a natural entry point for comparing regional climates, which supports cross-curricular connections to geography and environmental science.
How can I support students who struggle with interpreting elevation and precipitation diagrams?
For students who find diagram interpretation challenging, start with simplified cross-section illustrations that label only the key features: windward slope, leeward slope, cloud formation zone, and rain shadow zone. Wayground's Read Aloud feature can support students who need text read to them during digital activities, and Reduced Answer Choices can lower cognitive load for students who feel overwhelmed by complex multiple-choice items. Pairing diagram-based questions with brief written explanations also helps students connect visual information to scientific reasoning rather than guessing from images alone.