
16 Q
8th - Uni
20 Q
9th - Uni
25 Q
10th - 12th
11 Q
9th - Uni
19 Q
9th - 11th
15 Q
9th - 12th
20 Q
11th - Uni
20 Q
11th - Uni
20 Q
9th - Uni
15 Q
8th - Uni
10 Q
8th - Uni
14 Q
11th - 12th
12 Q
7th - Uni
20 Q
6th - Uni
12 Q
11th
11 Q
8th - Uni
18 Q
11th
10 Q
8th - Uni
12 Q
9th - 12th
10 Q
10th - 12th
6 Q
11th
9 Q
11th
15 Q
6th - Uni
20 Q
8th - Uni
Explore Other Subject Worksheets for grade 11
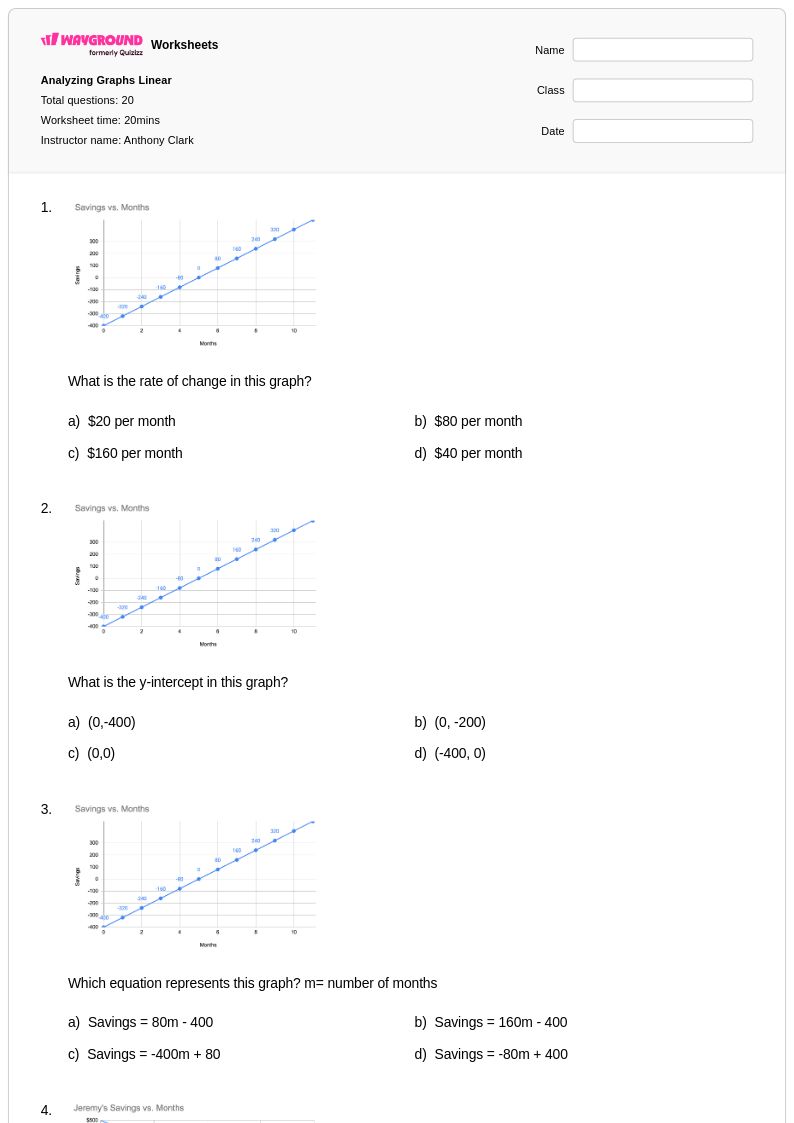
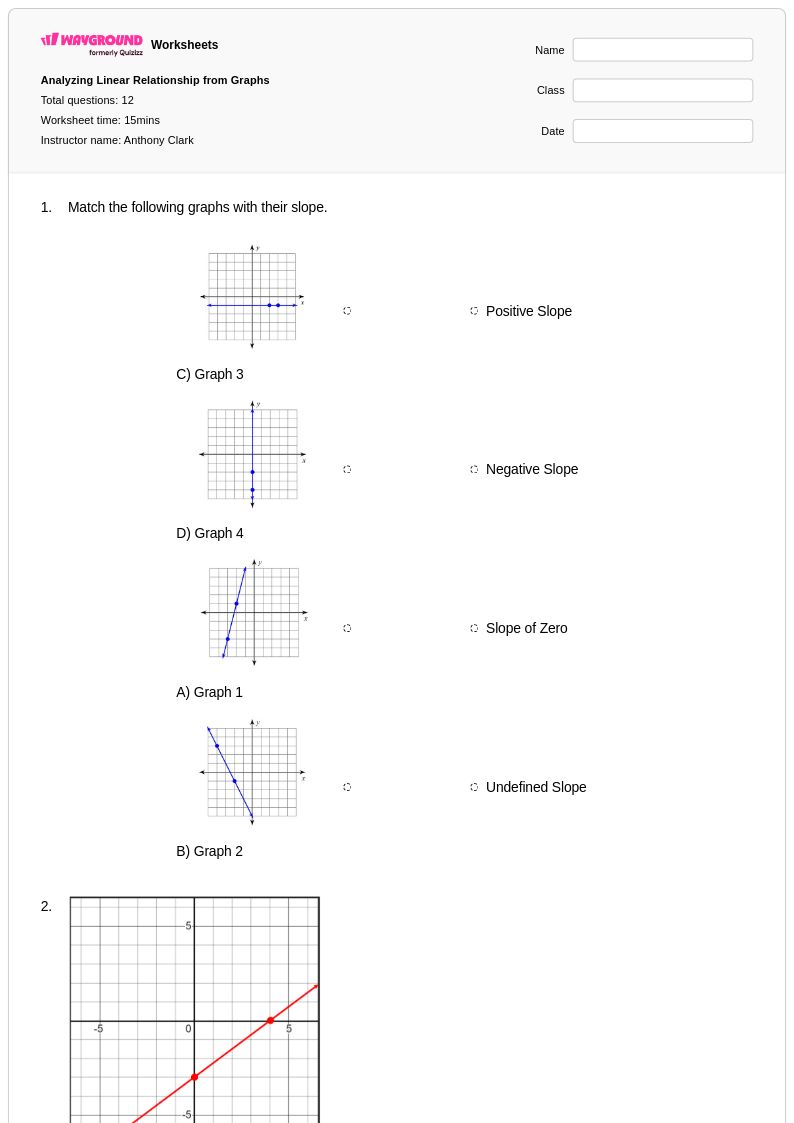
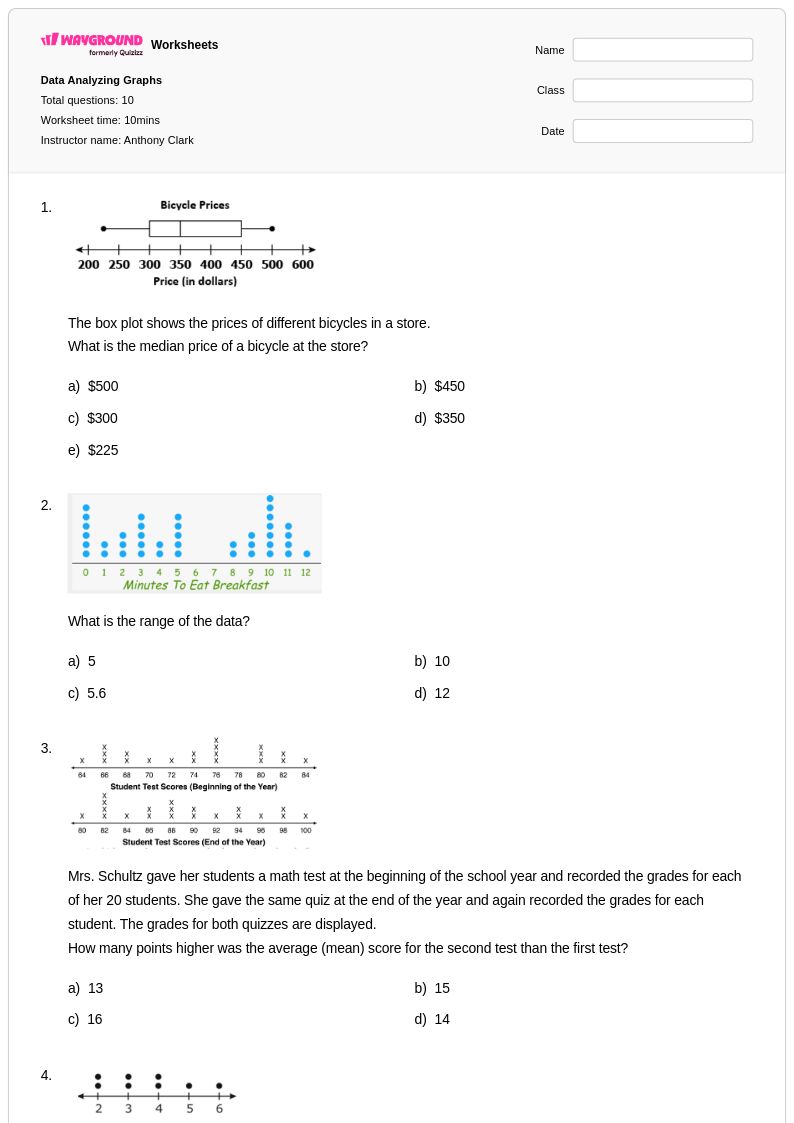
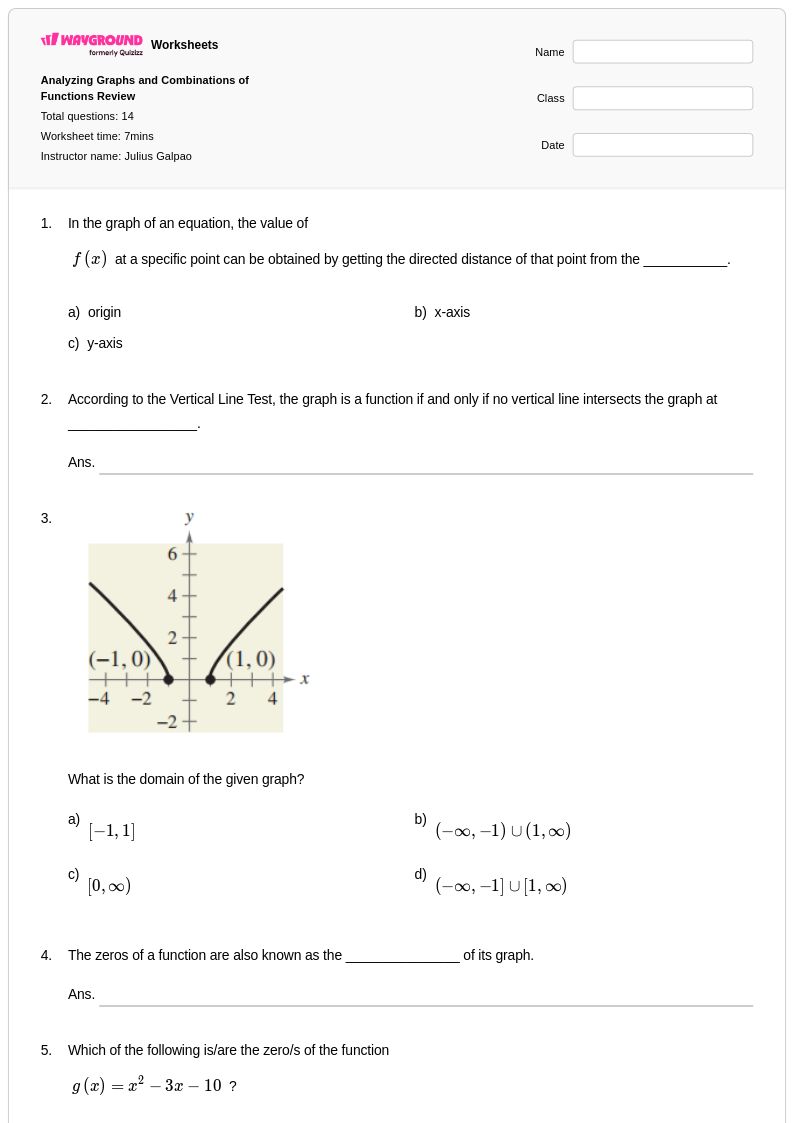
Explore printable Analyzing Graphs worksheets for Grade 11
Analyzing graphs represents a fundamental skill in Grade 11 mathematics that bridges statistical literacy with advanced mathematical reasoning. Wayground's comprehensive collection of analyzing graphs worksheets provides students with systematic practice in interpreting, evaluating, and drawing conclusions from various graphical representations including scatter plots, line graphs, bar charts, and statistical distributions. These carefully designed practice problems strengthen critical thinking skills by challenging students to identify trends, recognize patterns, calculate rates of change, and make data-driven predictions. Each worksheet includes a complete answer key and is available as a free pdf download, making it convenient for both classroom instruction and independent study. The printables cover essential concepts such as correlation analysis, outlier identification, slope interpretation, and comparative data analysis that form the foundation for advanced statistical studies.
Wayground, formerly Quizizz, empowers educators with millions of teacher-created resources specifically designed for Grade 11 data analysis instruction. The platform's robust search and filtering capabilities allow teachers to quickly locate worksheets that align with curriculum standards and match their students' specific learning objectives. Advanced differentiation tools enable instructors to customize content difficulty levels, ensuring appropriate challenges for diverse learners while maintaining focus on core graph analysis competencies. These resources are available in both printable pdf format and interactive digital versions, providing flexibility for various teaching environments and learning preferences. Teachers can efficiently plan remediation sessions for struggling students, create enrichment activities for advanced learners, and design targeted skill practice that addresses specific areas of weakness in graphical interpretation and statistical reasoning.