
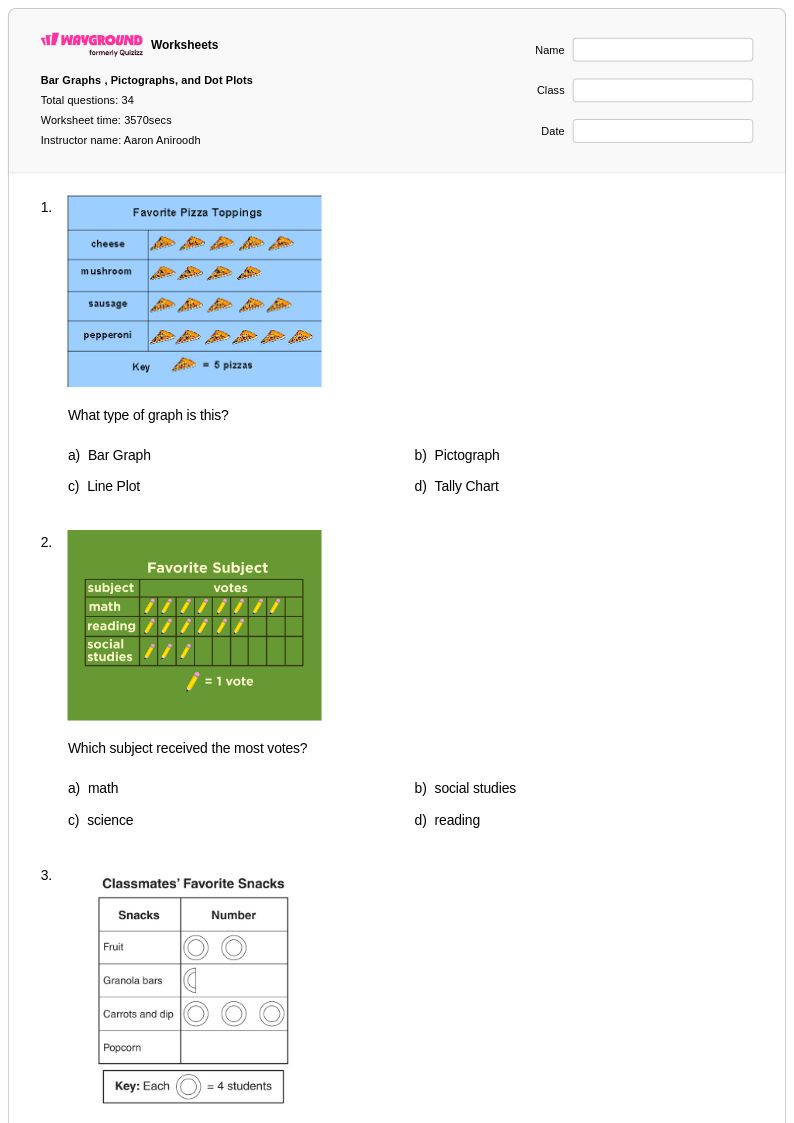
34 Q
3rd
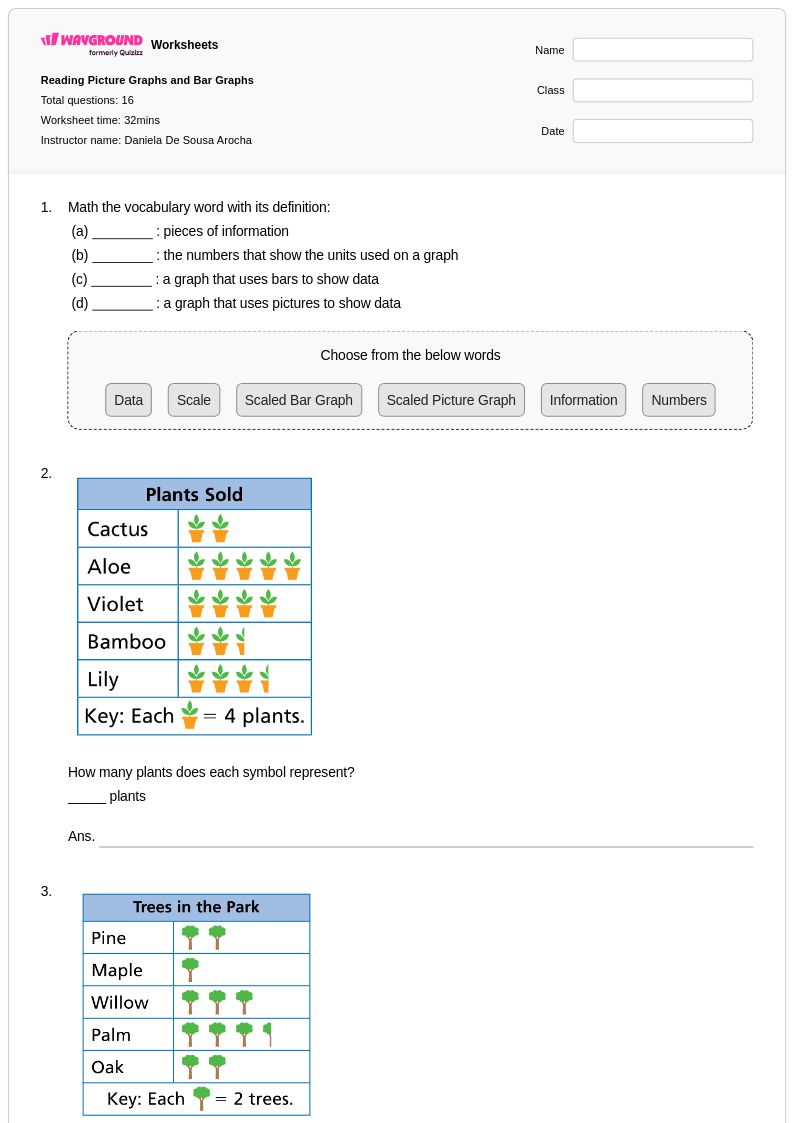
16 Q
3rd
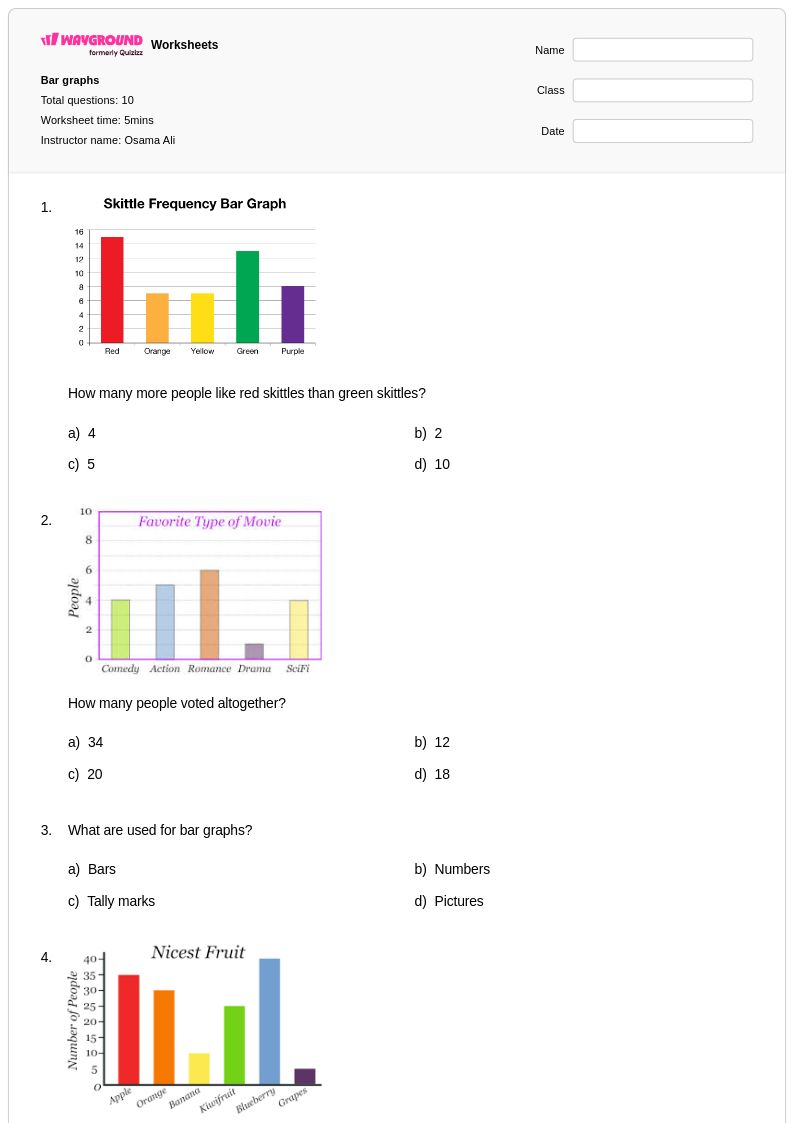
10 Q
3rd
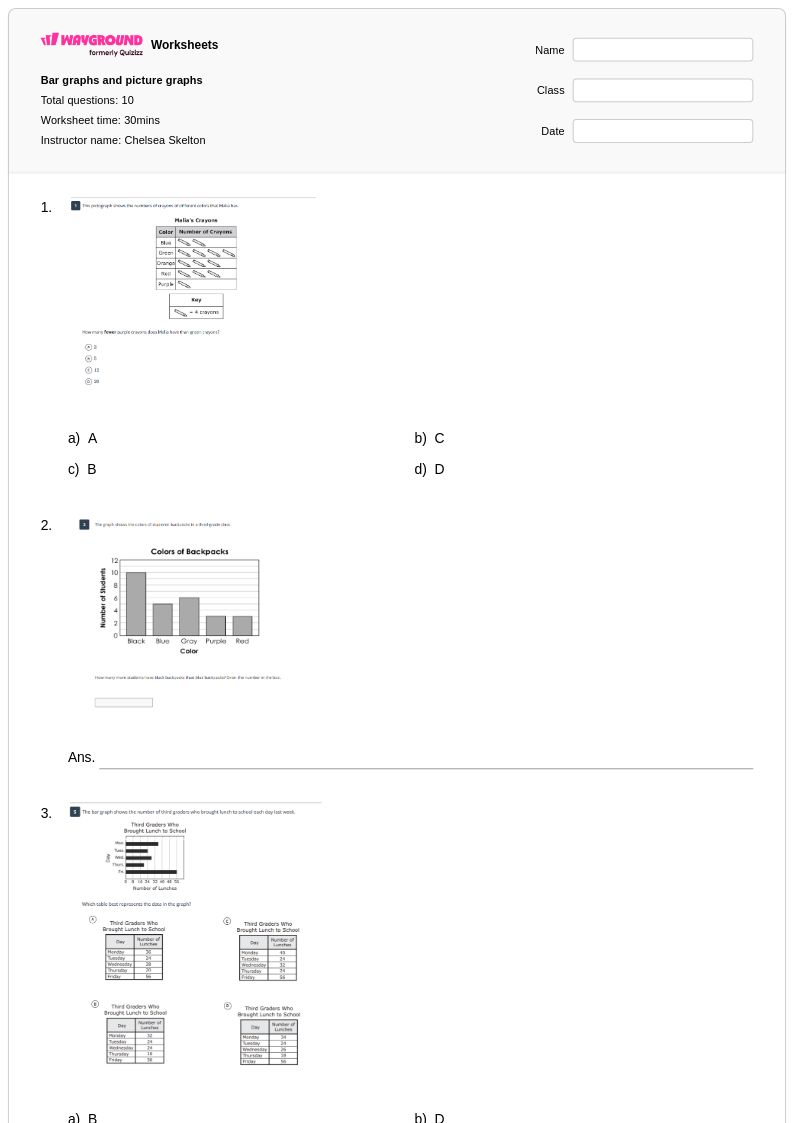
10 Q
3rd
20 Q
1st - 3rd
15 Q
3rd
13 Q
3rd
10 Q
3rd - PD
7 Q
2nd - Uni
13 Q
3rd

33 Q
3rd
12 Q
3rd
15 Q
3rd - 4th
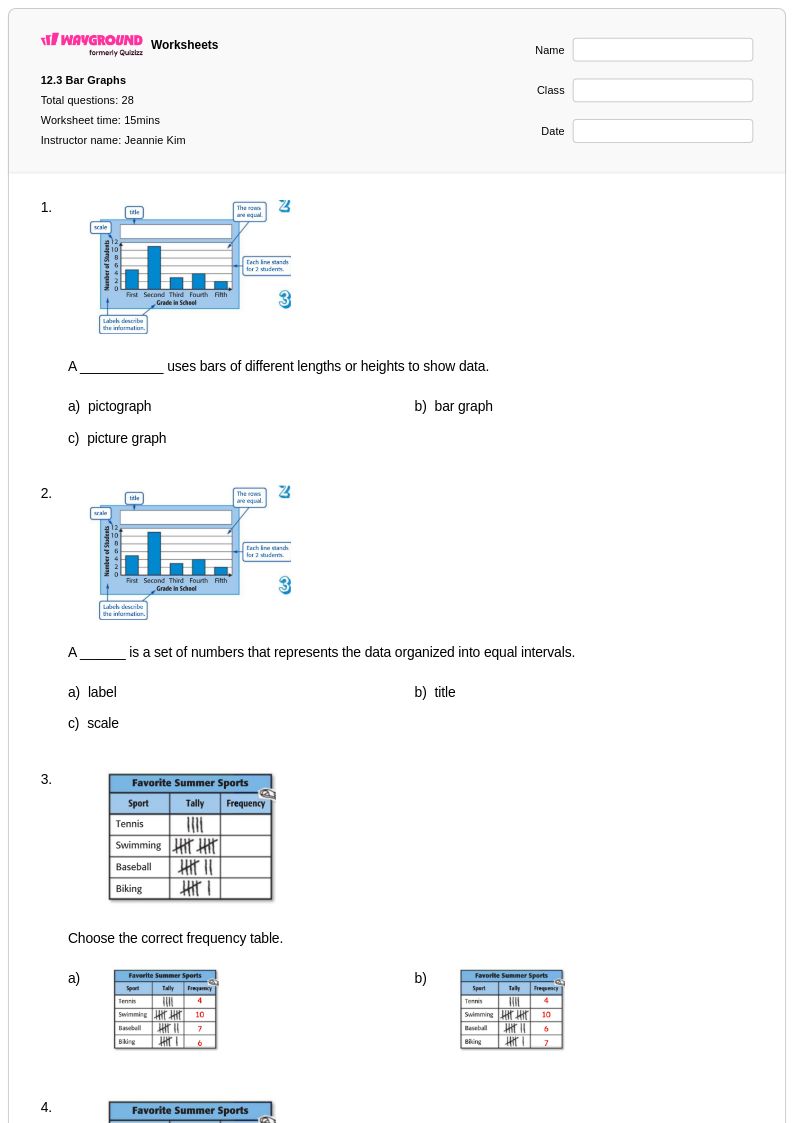
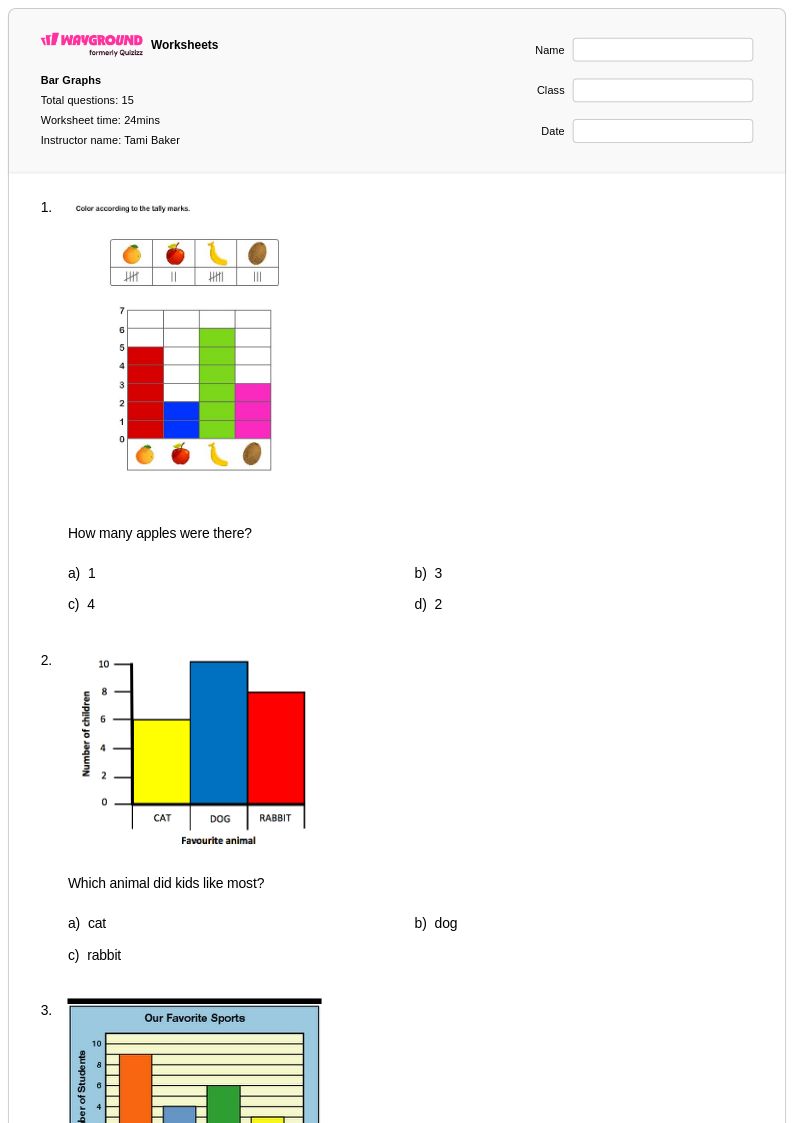
28 Q
3rd
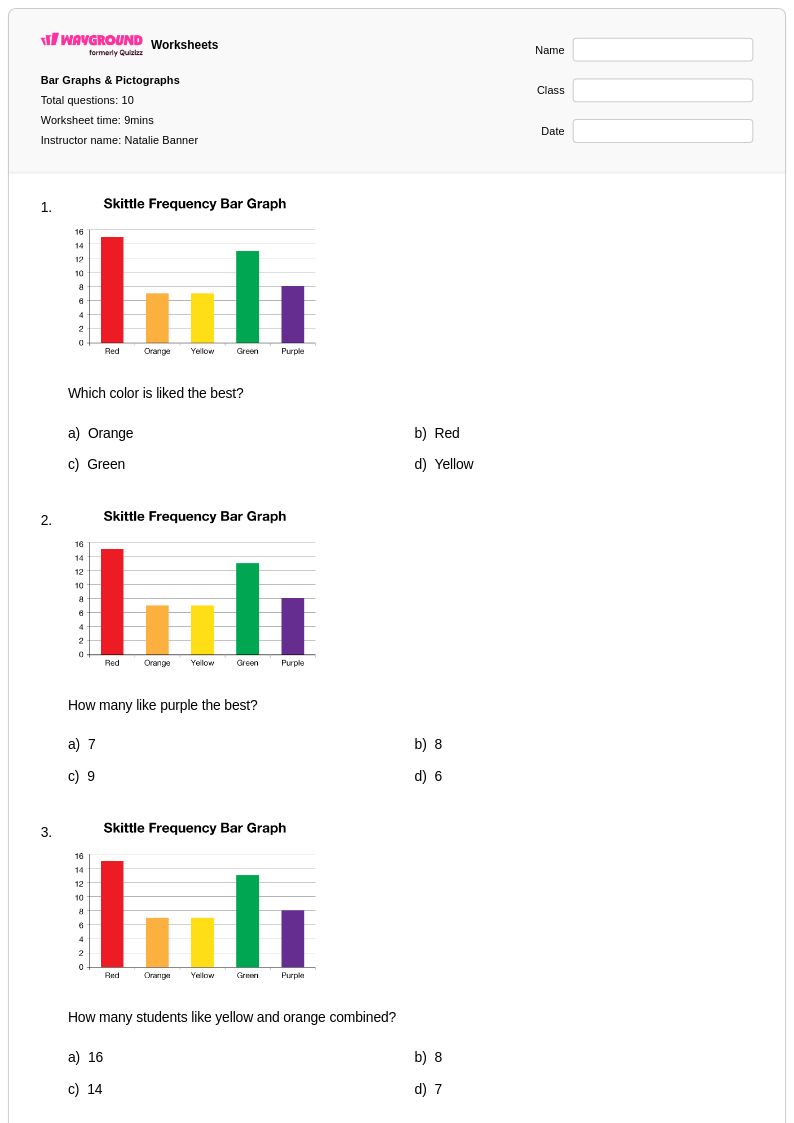
10 Q
3rd
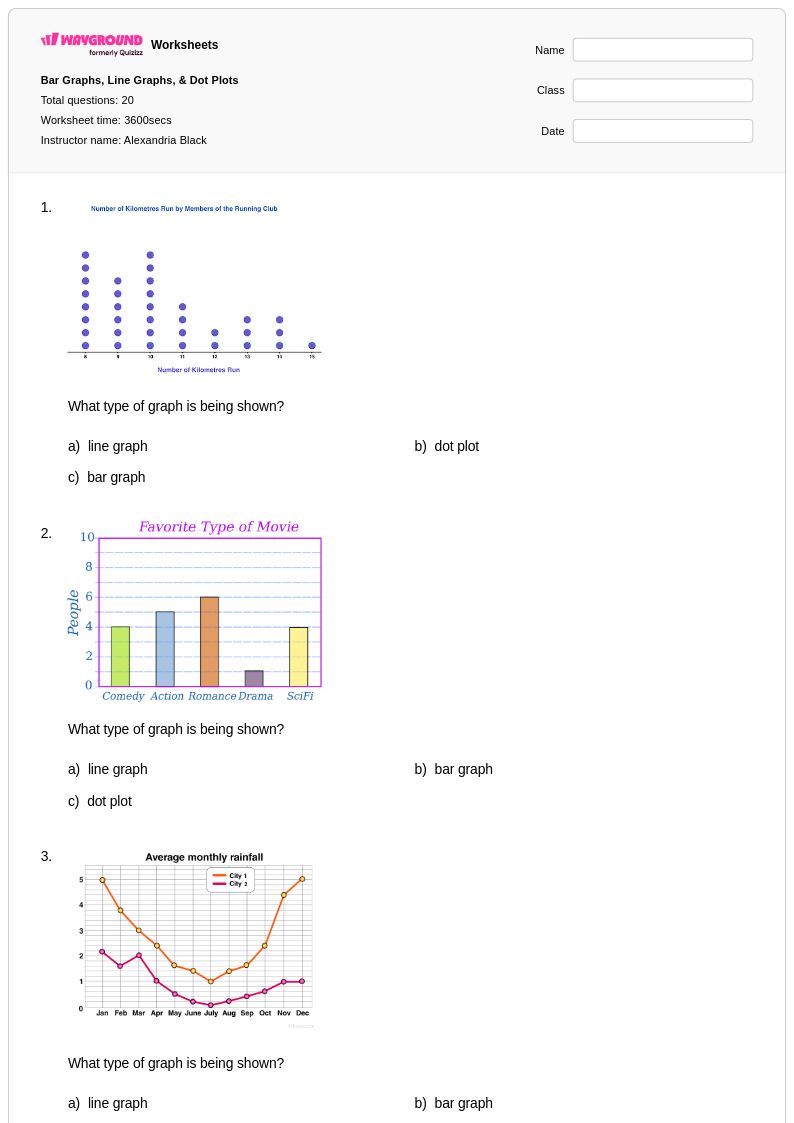
20 Q
1st - 5th
15 Q
1st - 3rd
10 Q
2nd - 3rd
20 Q
2nd - 3rd
20 Q
1st - 5th
11 Q
3rd
5 Q
3rd
15 Q
3rd
20 Q
3rd - Uni
Explore Other Subject Worksheets for grade 3
Explore printable Bar Graphs worksheets for Grade 3
Grade 3 bar graph worksheets available through Wayground (formerly Quizizz) provide essential practice for students developing foundational data visualization skills. These comprehensive printables focus on teaching young learners how to read, interpret, and create bar graphs using age-appropriate data sets such as favorite pets, sports preferences, or classroom surveys. Each worksheet strengthens critical mathematical thinking by guiding students through the process of analyzing pictorial data, counting units, comparing quantities, and drawing conclusions from visual information. The practice problems progress systematically from basic graph reading exercises to more complex tasks requiring students to construct their own bar graphs, with answer keys provided to support independent learning and enable teachers to quickly assess student understanding in both pdf and digital formats.
Wayground (formerly Quizizz) empowers Grade 3 educators with access to millions of teacher-created bar graph resources that streamline lesson planning and differentiated instruction. The platform's robust search and filtering capabilities allow teachers to quickly locate worksheets aligned with specific curriculum standards and learning objectives, while customization tools enable educators to modify existing materials or create original content tailored to their students' needs. These flexible resources support diverse teaching approaches through both printable pdf formats for traditional classroom use and digital versions for interactive learning experiences. Teachers can efficiently address individual student needs by selecting from varied difficulty levels within the bar graph collection, making it simple to provide targeted remediation for struggling learners while offering enrichment opportunities for advanced students ready to tackle more sophisticated data interpretation challenges.