
12 Q
1st - 3rd
8 Q
3rd - 6th

20 Q
2nd - 4th
14 Q
3rd
14 Q
3rd
12 Q
2nd - 6th
10 Q
3rd
16 Q
3rd
16 Q
3rd - 5th
14 Q
3rd
14 Q
3rd
14 Q
3rd
34 Q
3rd

14 Q
3rd
8 Q
3rd
10 Q
3rd
8 Q
3rd
20 Q
3rd - Uni
12 Q
3rd
10 Q
3rd - 5th
15 Q
3rd - 4th
8 Q
3rd
14 Q
3rd
12 Q
3rd
Explore Other Subject Worksheets for grade 3
Explore printable Pie Graphs worksheets for Grade 3
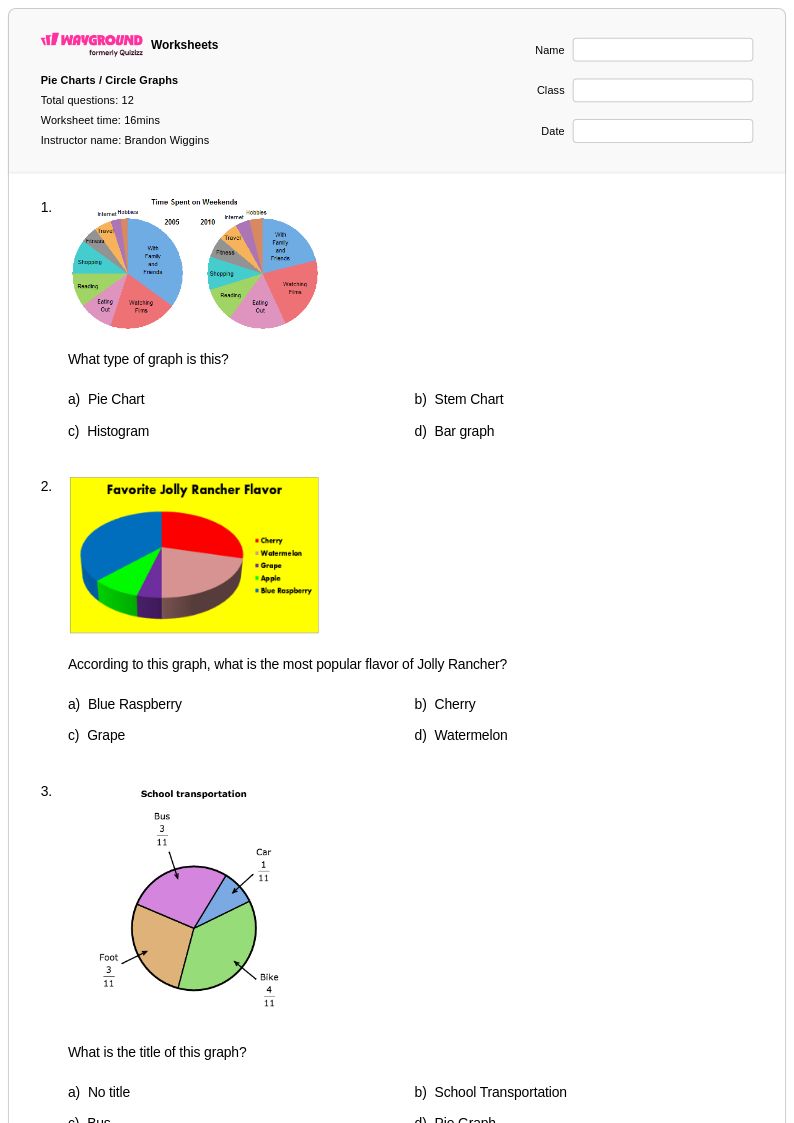
Pie graphs for Grade 3 students represent a foundational step in developing data visualization and interpretation skills that will serve students throughout their mathematical education. Wayground's extensive collection of pie graph worksheets helps third-grade learners understand how to read, analyze, and create these circular data displays that show parts of a whole. These carefully designed practice problems guide students through essential concepts such as identifying different sections of a pie chart, comparing the sizes of various segments, and drawing conclusions from the visual data presented. Each worksheet includes a comprehensive answer key to support both independent learning and teacher-guided instruction, with free printable pdf formats making it easy for educators to distribute materials that strengthen students' ability to work with fractional parts and basic data analysis.
Wayground, formerly Quizizz, empowers teachers with millions of educator-created resources specifically designed to support Grade 3 pie graph instruction through robust search and filtering capabilities that help locate age-appropriate materials aligned with mathematical standards. The platform's differentiation tools enable teachers to customize worksheets based on individual student needs, whether for remediation of struggling learners or enrichment activities for advanced students. These pie graph resources are available in both printable and digital pdf formats, providing flexibility for classroom instruction, homework assignments, and assessment preparation. Teachers can efficiently plan comprehensive data and graphing units while ensuring students receive targeted practice with visual data interpretation skills that build confidence and mathematical reasoning abilities essential for future success in statistics and data analysis.