
30 Q
4th - 6th
10 Q
5th - 6th
5 Q
6th
6 Q
6th
15 Q
6th
20 Q
6th - 8th
8 Q
3rd - 6th
20 Q
6th - Uni
10 Q
6th - 8th
10 Q
6th - 8th
10 Q
6th - 8th
15 Q
6th
25 Q
6th
10 Q
6th
19 Q
6th
12 Q
2nd - 6th
10 Q
6th
16 Q
5th - 6th
14 Q
6th - 8th
20 Q
6th - Uni
15 Q
5th - Uni
20 Q
5th - Uni
10 Q
4th - 6th
18 Q
6th - 8th
Explore Other Subject Worksheets for grade 6
Explore printable Pie Graphs worksheets for Grade 6
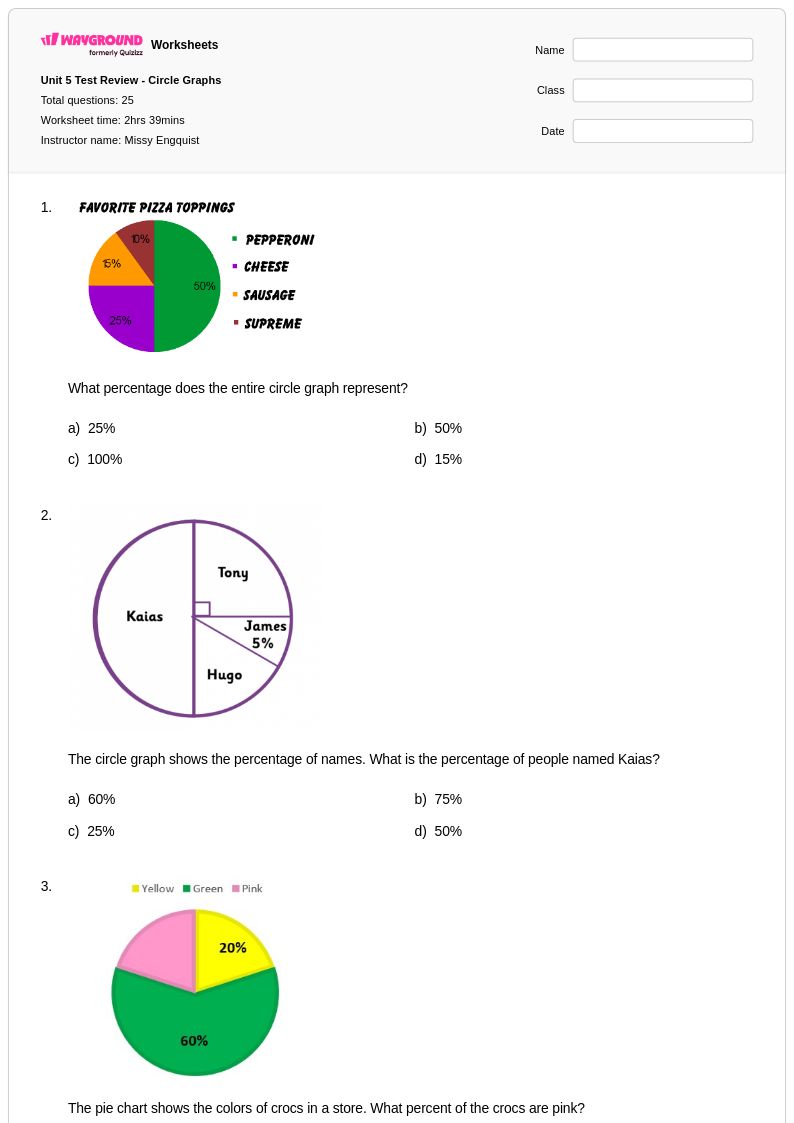
Grade 6 pie graphs worksheets available through Wayground (formerly Quizizz) provide comprehensive practice in interpreting, analyzing, and creating circular data representations that are fundamental to statistical literacy. These carefully designed worksheets strengthen essential mathematical skills including calculating percentages, converting fractions to degrees, determining central angles, and translating raw data into meaningful visual displays. Students work through practice problems that challenge them to read pie charts accurately, compare data segments, and draw conclusions from graphical information. Each worksheet includes a complete answer key, making it easy for educators to provide immediate feedback and support student learning. These free printables cover various real-world scenarios from sports statistics to survey results, helping sixth graders understand how pie graphs communicate proportional relationships in everyday contexts.
Wayground (formerly Quizizz) supports mathematics educators with millions of teacher-created resources specifically focused on data visualization and graphing concepts appropriate for middle school learners. The platform's robust search and filtering capabilities allow teachers to quickly locate pie graph worksheets that align with specific curriculum standards and learning objectives. Differentiation tools enable educators to customize materials for diverse learning needs, while flexible formatting options provide both printable pdf versions for traditional classroom use and digital formats for technology-integrated instruction. These features streamline lesson planning and offer versatile options for skill practice, targeted remediation for struggling students, and enrichment activities for advanced learners. Teachers can efficiently assess student understanding of proportional reasoning and data interpretation while building the foundational graphing skills that prepare students for more complex statistical concepts in higher grade levels.