
24 Q
6th

11 Q
6th - 10th

11 Q
6th - 10th
19 Q
4th - Uni
13 Q
6th - Uni

11 Q
6th - 10th

11 Q
6th - 10th
20 Q
4th - Uni
20 Q
4th - Uni
14 Q
4th - Uni
6 Q
6th
20 Q
6th
15 Q
6th
15 Q
4th - Uni
5 Q
6th
23 Q
6th - 12th
15 Q
4th - Uni
10 Q
4th - Uni
15 Q
4th - Uni
19 Q
6th
20 Q
4th - Uni
10 Q
6th
20 Q
6th - Uni

11 Q
6th - 10th
Explore Data Representation Worksheets by Grades
Explore Other Subject Worksheets for grade 6
Explore printable Data Representation worksheets for Grade 6
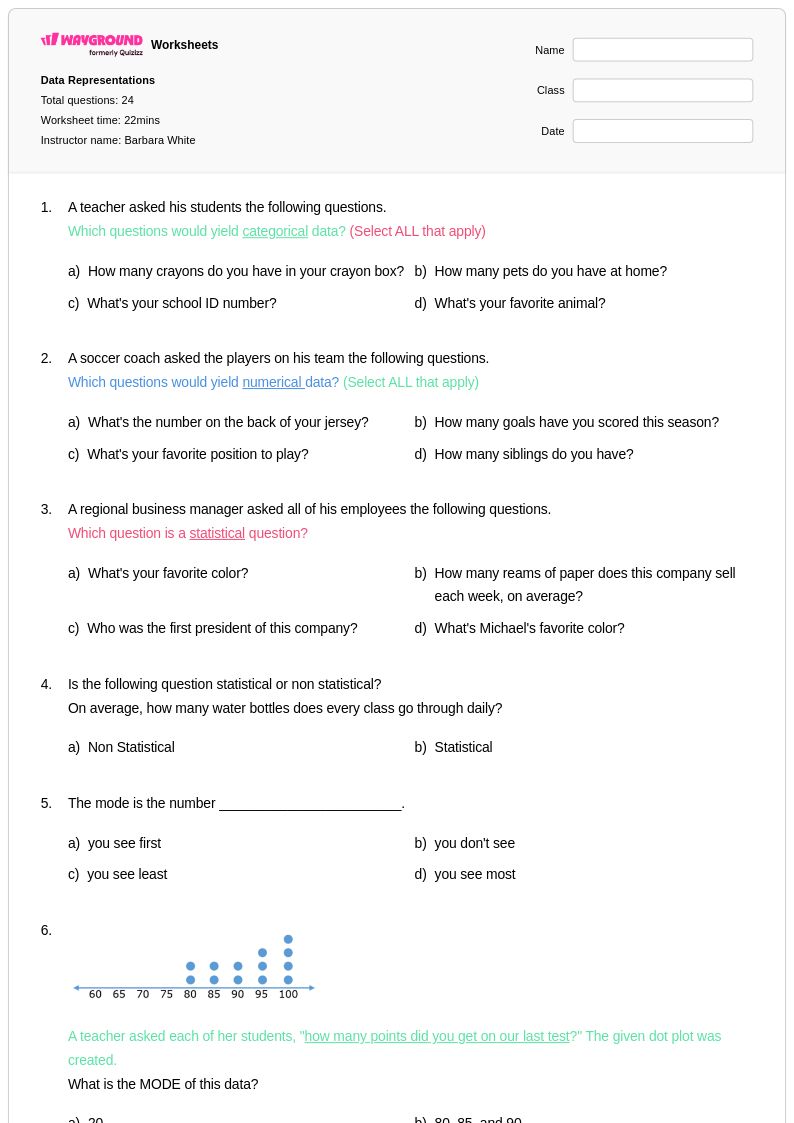
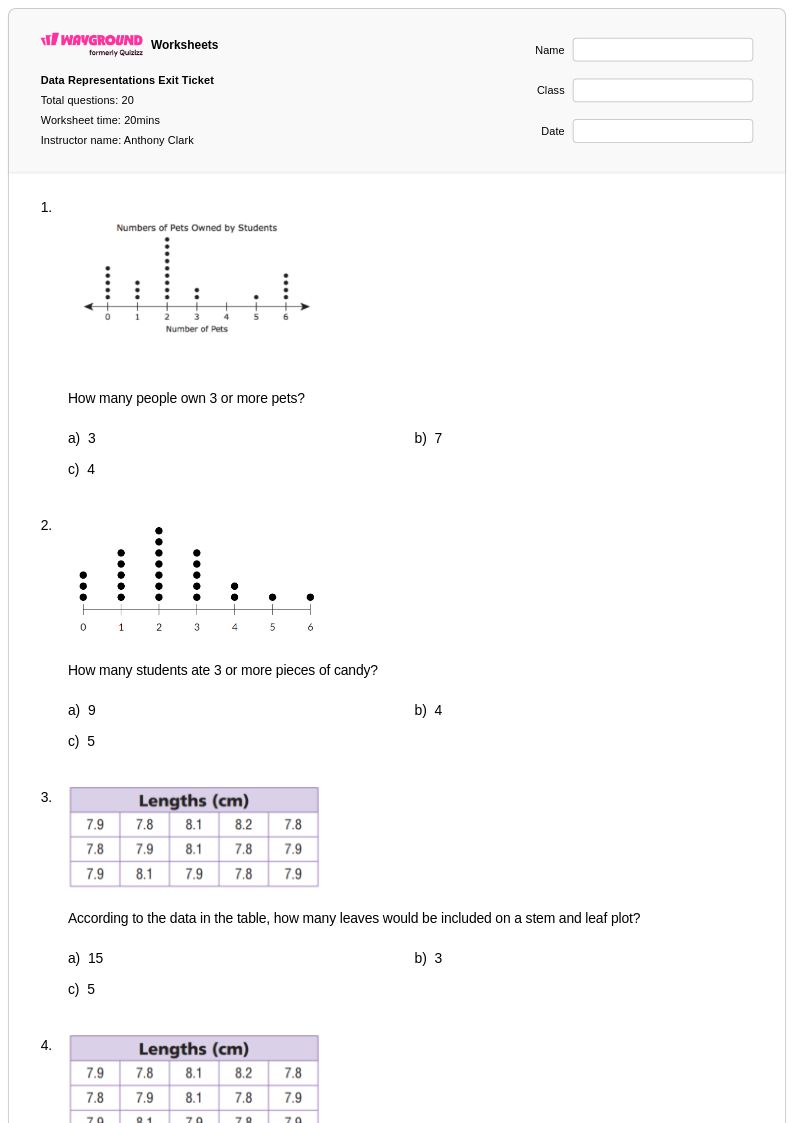
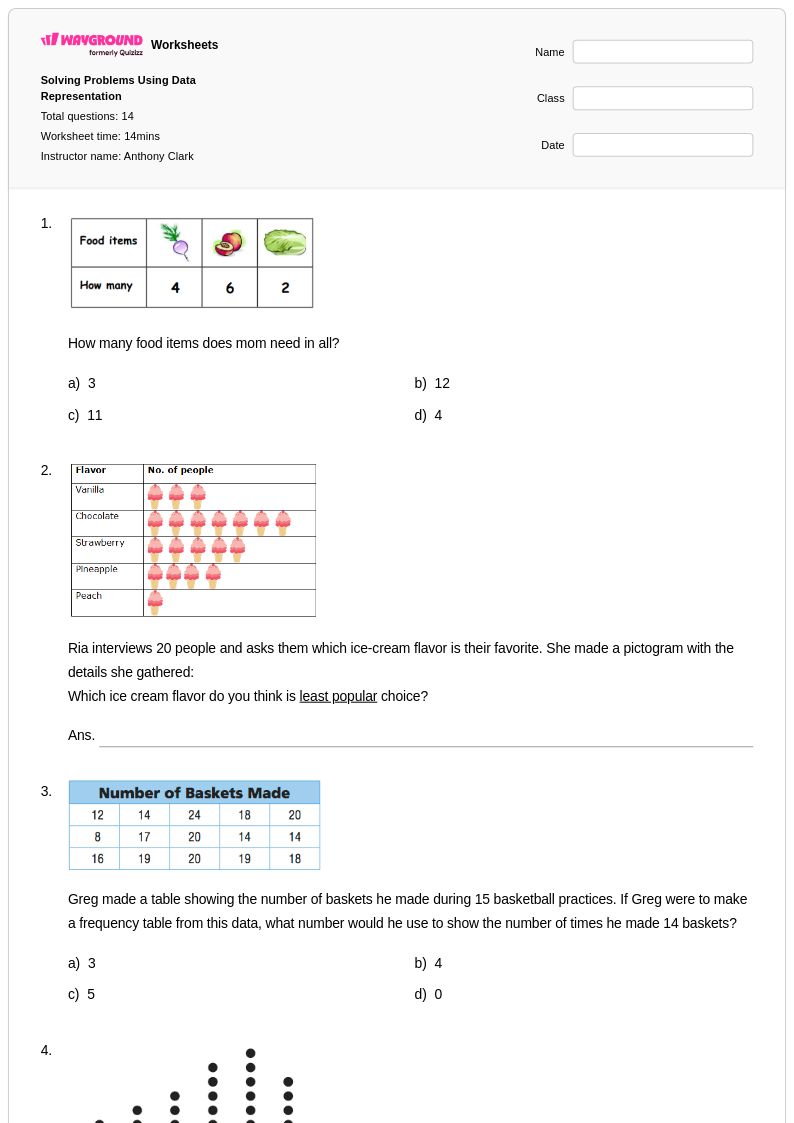
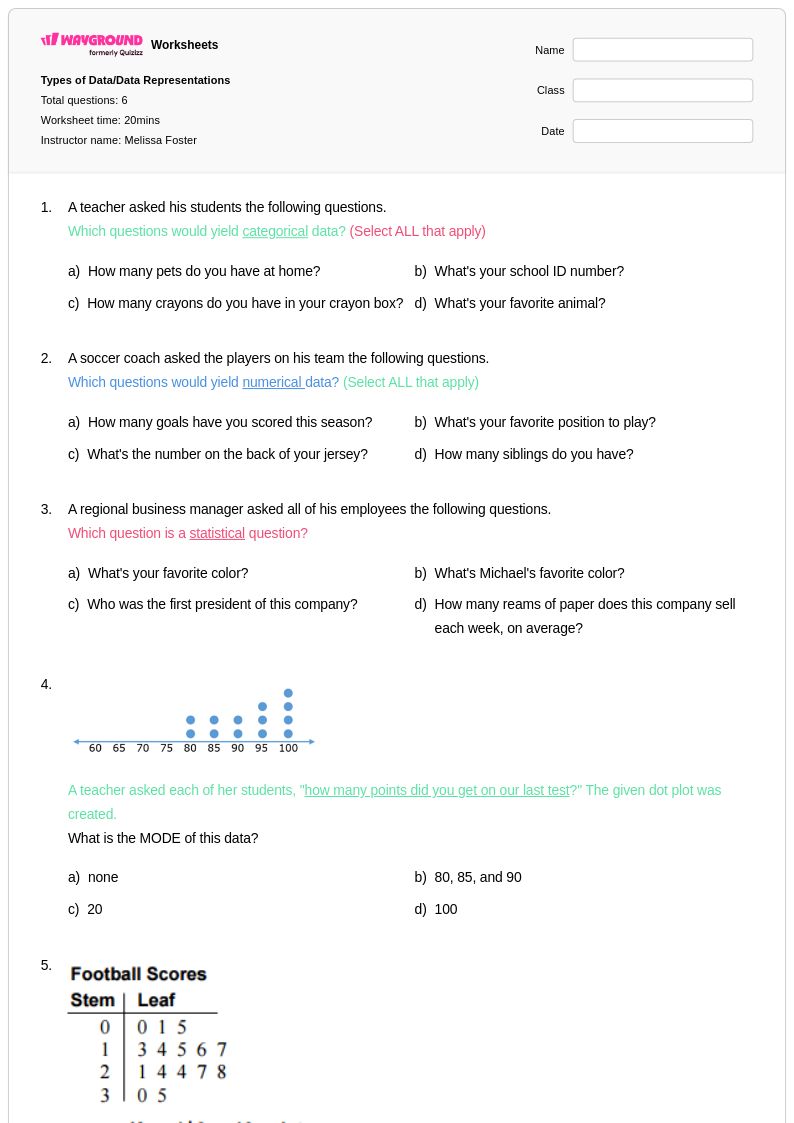
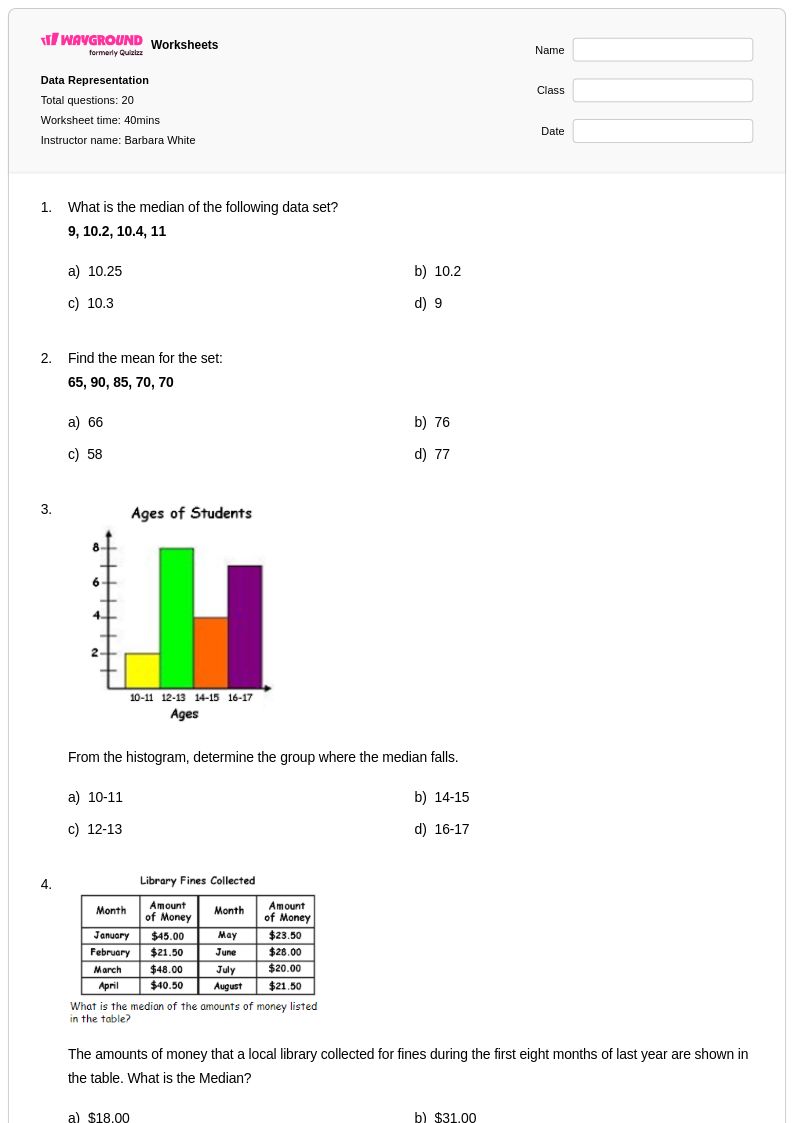
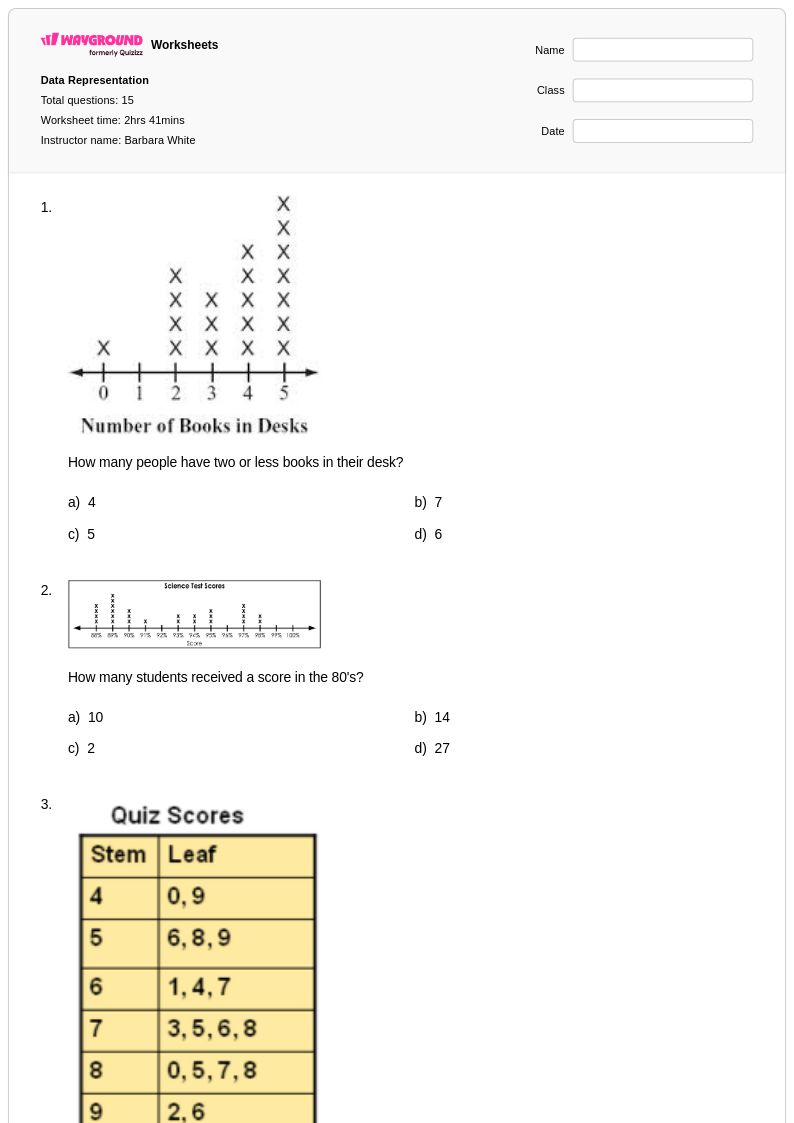
Data representation worksheets for Grade 6 through Wayground provide students with essential practice in organizing, interpreting, and presenting information through various visual formats including bar graphs, line plots, histograms, and pie charts. These comprehensive practice problems help sixth-grade students develop critical skills in collecting data, choosing appropriate graphical representations, and analyzing trends and patterns within datasets. Each worksheet comes with a detailed answer key and is available as a free printable pdf, allowing students to work through real-world scenarios such as survey results, temperature changes, and population statistics while building fluency in mathematical communication and data literacy.
Wayground's extensive collection of teacher-created data representation resources offers educators access to millions of differentiated worksheets designed specifically for Grade 6 mathematics standards. The platform's advanced search and filtering capabilities enable teachers to quickly locate materials aligned with specific learning objectives, whether students need foundational practice with basic graph creation or enrichment activities involving complex data analysis. These customizable resources are available in both printable and digital formats, supporting flexible lesson planning for remediation, skill practice, and assessment preparation while ensuring that every student can access appropriately challenging content that builds confidence in interpreting and creating meaningful data visualizations.