Statistical Graphs and Charts - Printable Histogram-interpretation Worksheets Grade 12 - Quizizz
Statistical Graphs and Charts

20 Q

12th - Uni

Histograms (NUHS Section 2.1 Prob & Stats) - Printable Histogram-interpretation Worksheets Grade 12 - Quizizz
Histograms (NUHS Section 2.1 Prob & Stats)

22 Q

10th - 12th

Scatter Plots, Dot Plots, Histograms - Printable Histogram-interpretation Worksheets Grade 12 - Quizizz
Scatter Plots, Dot Plots, Histograms

70 Q

9th - 12th

2.1 Histograms and Frequency Tables Practice - Printable Histogram-interpretation Worksheets Grade 12 - Quizizz
2.1 Histograms and Frequency Tables Practice

18 Q

12th

Linear Interpretation and Scatterplot - Printable Histogram-interpretation Worksheets Grade 12 - Quizizz
Linear Interpretation and Scatterplot

20 Q

12th - Uni

Data Analysis EOC (2024) - Printable Histogram-interpretation Worksheets Grade 12 - Quizizz
Data Analysis EOC (2024)

25 Q

9th - Uni

AP Statistics Unit 6 Vocabulary - Printable Histogram-interpretation Worksheets Grade 12 - Quizizz
AP Statistics Unit 6 Vocabulary

14 Q

12th - Uni

Stats - Printable Histogram-interpretation Worksheets Grade 12 - Quizizz
Stats

13 Q

12th - Uni

More Descriptive Stats Practice - Printable Histogram-interpretation Worksheets Grade 12 - Quizizz
More Descriptive Stats Practice

23 Q

12th

AP Stats Summer Review - Printable Histogram-interpretation Worksheets Grade 12 - Quizizz
AP Stats Summer Review

18 Q

12th

Statistical Questions and Data Distribution - Printable Histogram-interpretation Worksheets Grade 12 - Quizizz
Statistical Questions and Data Distribution

19 Q

6th - Uni

Distributions of Data Quiz Review - Printable Histogram-interpretation Worksheets Grade 12 - Quizizz
Distributions of Data Quiz Review

10 Q

9th - 12th

Algebra 1 Unit 12 Lesson 1 Homework - Printable Histogram-interpretation Worksheets Grade 12 - Quizizz
Algebra 1 Unit 12 Lesson 1 Homework

13 Q

6th - Uni

9.1 - Intro to Statistics - Printable Histogram-interpretation Worksheets Grade 12 - Quizizz
9.1 - Intro to Statistics

14 Q

9th - 12th

Linear Functions Slope Interpretation - Printable Histogram-interpretation Worksheets Grade 12 - Quizizz
Linear Functions Slope Interpretation

15 Q

9th - Uni

Alg 1, Topic 11 Review - Printable Histogram-interpretation Worksheets Grade 12 - Quizizz
Alg 1, Topic 11 Review

14 Q

9th - 12th

Correlation Coefficient from Table of Values - Printable Histogram-interpretation Worksheets Grade 12 - Quizizz
Correlation Coefficient from Table of Values

14 Q

9th - Uni

Stats Review 1.1-1.3 - Printable Histogram-interpretation Worksheets Grade 12 - Quizizz
Stats Review 1.1-1.3

14 Q

12th

Chapter 2: Exploring Data with Tables & Graphs - Printable Histogram-interpretation Worksheets Grade 12 - Quizizz
Chapter 2: Exploring Data with Tables & Graphs

20 Q

9th - 12th

A1 - Unit 1 Review | Describing Data - Printable Histogram-interpretation Worksheets Grade 12 - Quizizz
A1 - Unit 1 Review | Describing Data

12 Q

9th - 12th

Unit 6 Stats - 6.2 Lesson Check - Printable Histogram-interpretation Worksheets Grade 12 - Quizizz
Unit 6 Stats - 6.2 Lesson Check

20 Q

9th - 12th

CRM 4.1 Practice Test - Printable Histogram-interpretation Worksheets Grade 12 - Quizizz
CRM 4.1 Practice Test

19 Q

9th - 12th

Stat quizizz 2 - Printable Histogram-interpretation Worksheets Grade 12 - Quizizz
Stat quizizz 2

20 Q

12th - Uni

Correlation vs Causation Graph - Printable Histogram-interpretation Worksheets Grade 12 - Quizizz
Correlation vs Causation Graph

19 Q

9th - Uni

Explore printable Histogram Interpretation worksheets for Grade 12

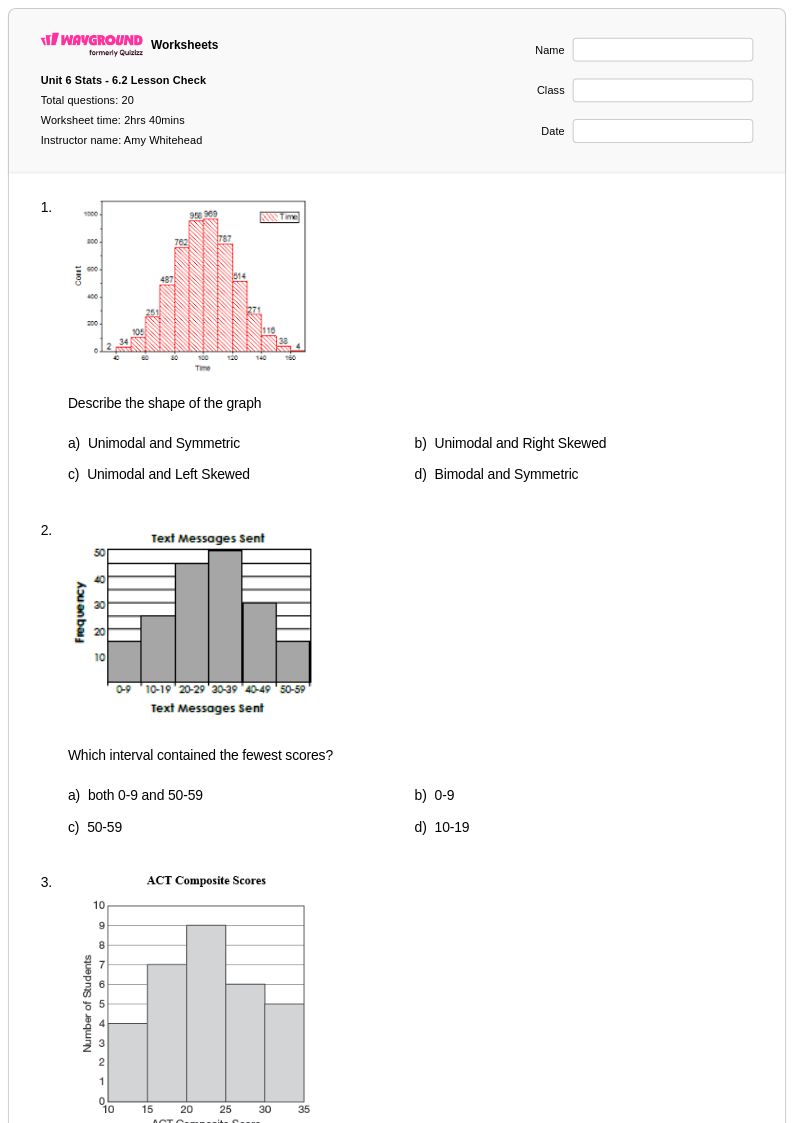
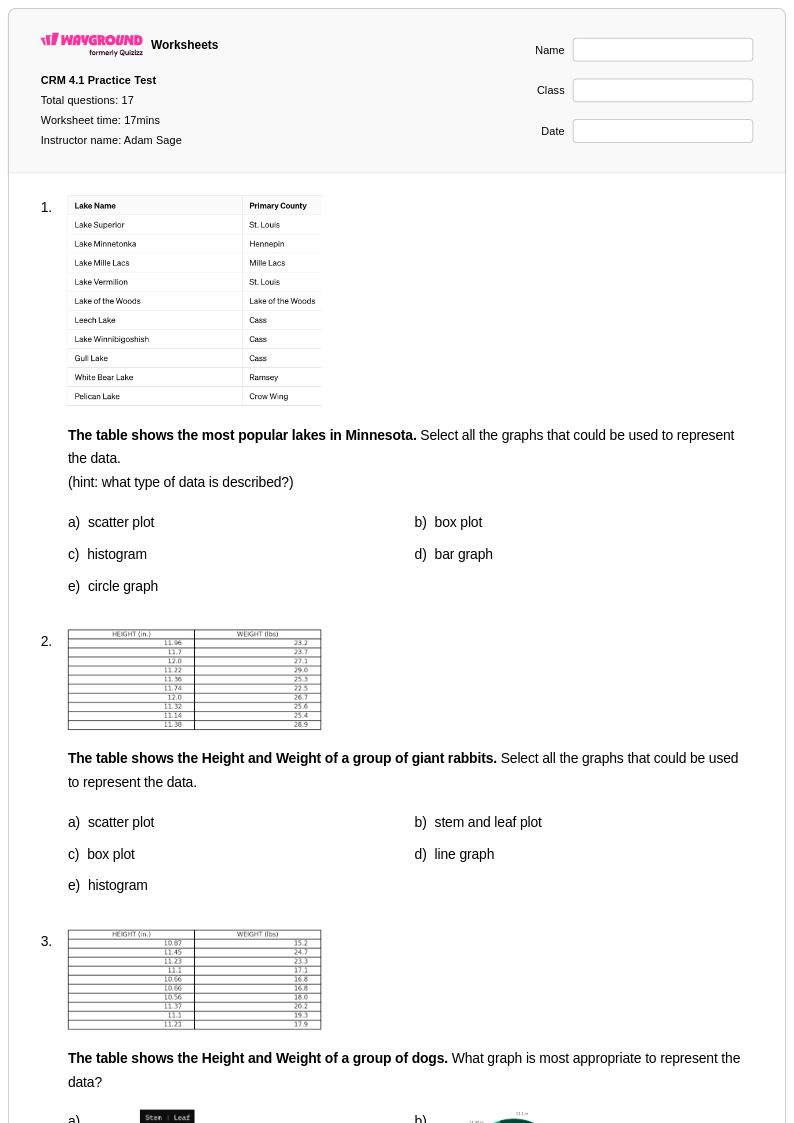
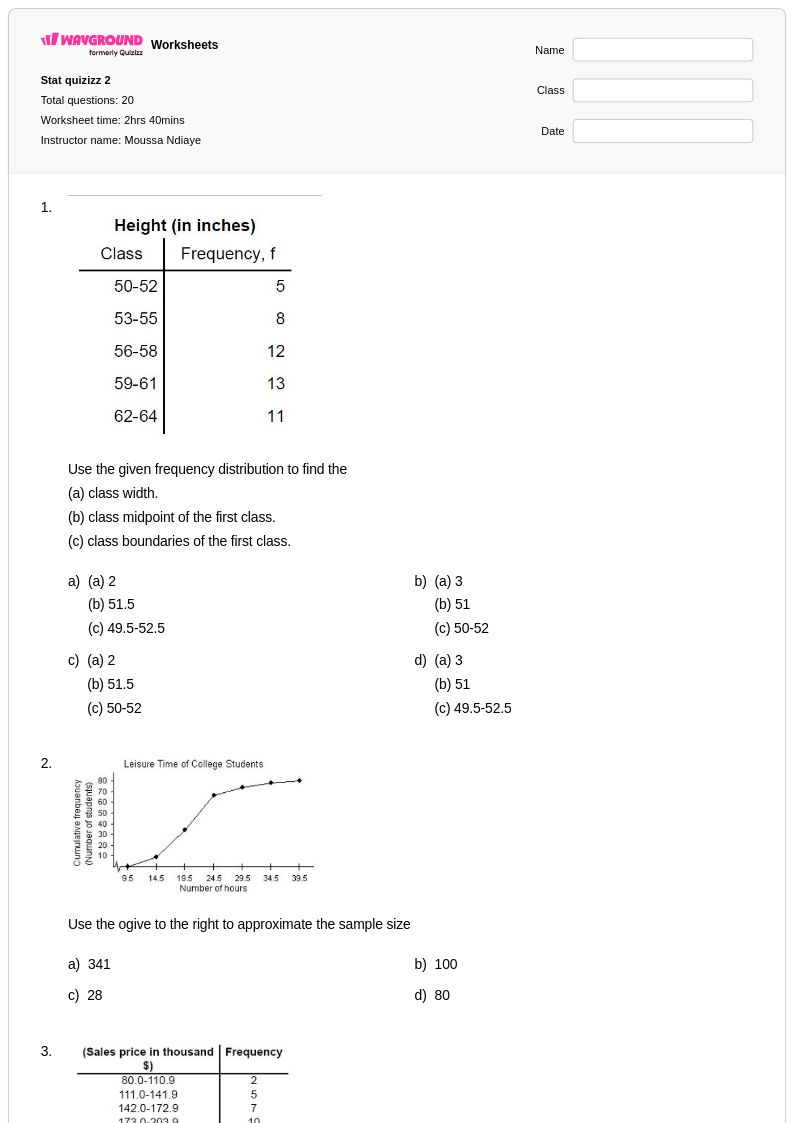
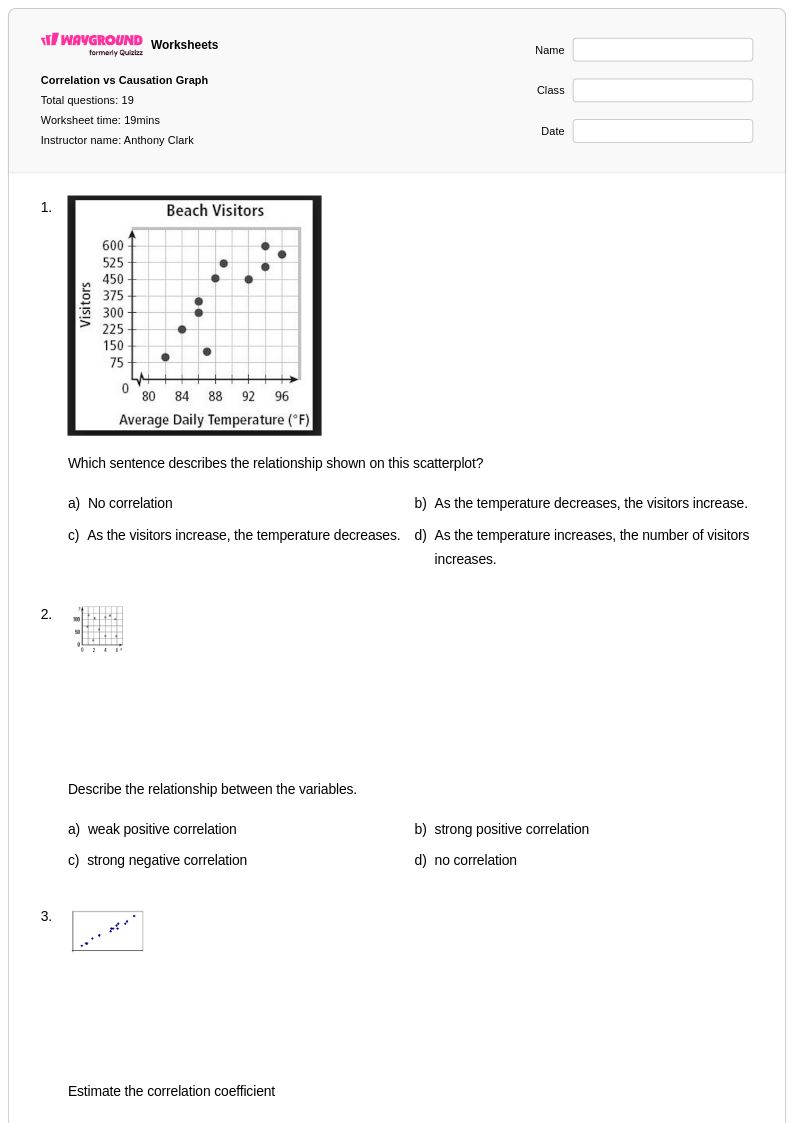
Histogram interpretation worksheets for Grade 12 mathematics provide students with essential practice in analyzing and drawing conclusions from frequency distribution graphs. These comprehensive resources available through Wayground (formerly Quizizz) focus on developing critical data analysis skills including reading histogram bars, calculating measures of central tendency from grouped data, identifying distribution shapes, and making statistical inferences. Students work through practice problems that challenge them to interpret real-world data sets, compare multiple histograms, and articulate their findings using appropriate mathematical language. Each worksheet includes detailed answer keys that support independent learning and self-assessment, while the free printable pdf format ensures accessibility for both classroom instruction and home study.

Wayground (formerly Quizizz) empowers educators with millions of teacher-created histogram interpretation resources specifically designed for Grade 12 mathematics instruction. The platform's robust search and filtering capabilities enable teachers to locate worksheets that align with specific curriculum standards and match their students' diverse learning needs. Differentiation tools allow instructors to customize difficulty levels and modify problems to support both remediation for struggling learners and enrichment opportunities for advanced students. Available in both printable and digital formats including downloadable pdfs, these resources seamlessly integrate into lesson planning while providing flexible options for skill practice, formative assessment, and targeted intervention strategies that strengthen students' statistical reasoning abilities.