
NEW
Font size
S
M
L
XL
 Worksheets
CP Stats Fall Review
Total questions: 34
Worksheet time: 31mins
Name
Class
Date
1.
The distribution of housing prices is strongly skewed to the right. Which of the following is true?
a)
The mean of the housing prices is less than the median.
b)
We should use a histogram to display the data.
c)
The mean of the housing prices is less than the mode.
d)
A boxplot is the best method of displaying the data graphically.
2.

Consider the graph above. Which of the following are true:
a)
The mean and the IQR should be used to describe the distribution.
b)
The median is larger than the mean because it is skewed right.
c)
The mean is smaller than the median because it is skewed left.
d)
It is difficult to see the shape because its scale is too small.
3.
Berta's tests scores could be summarized as follows: mean = 76, median = 72, IQR = 10, and standard deviation = 11.5. Her teacher found a grading mistake on her last test, and raised Berta's 85 to a 93. Which of the following are true?
a)
The mean and the median will increase, but the IQR and standard deviation will stay the same.
b)
The mean and the standard devation will increase, but the IQR and median will stay the same.
c)
The median and the IQR will increase, but the mean and standard deviation will stay the same.
d)
The IQR and the standard deviation will increase, but the mean and IQR will stay the same.
4.
Consider the following 5 # summary: 5 8 11 14 19 Which of the following is NOT true?
a)
50% of the data is above 11.
b)
75% of the data is above 8.
c)
50% of the data lies between 5 and 11.
d)
50% of the data lies below 8.
5.

Maria's commute to work is 26 minutes. What percentile is her commute?
a)
80
b)
90
c)
20
d)
60
6.
The correlation between age of homework percentage and test average is 0.72. Which of the following must be true?
a)
72% of the variability in test averages is explained by our model.
b)
As the homework percentage increases by one percent, the test average increases by 0.72.
c)
If the homework percentage was 0, the test average would be 0.72
d)
If we changed the homework from percent to average points, the correlation would still be 0.72
7.
The average weight of a Maui dolphin is 90 pounds with a standard deviation of 2.5 pounds. Which of the following is NOT true?
a)
About 95% of Maui dolphins weigh between 85 and 95 pounds.
b)
50% of Maui dolphins weigh less than 90 pounds.
c)
34% of Maui dolphins weigh between 82.5 and 85 pounds.
d)
About 16% of Maui dolphins weigh more than 97.5 pounds.
8.
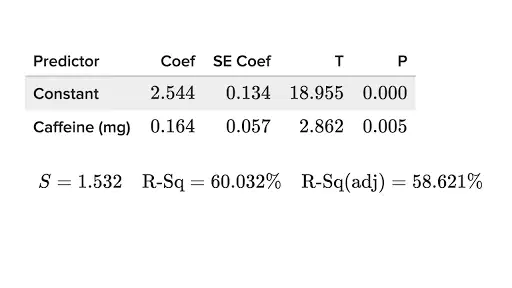
The computer output above predicts blood sugar levels from the amount of caffeine consumed. What is the Least Squares Regression Line?
a)
∧(blood sugar level)=.164+2.544(caffeine)
b)
∧(caffeine)=2.544+.164(blood sugar level)
c)
∧(blood sugar level)=2.544+.164(caffeine)
d)
∧(blood sugar level)=2.544+.134(caffeine)
9.

If the unusual point in the bottom right part of the plot is removed, what will happen to the correlation?
a)
The correlation will get closer to 0 because the data will be closer to a straight line.
b)
The correlation will be closer to 0 because there will be fewer observations in the data set.
c)
The correlation will be closer to 1 because the data will have a stronger positive linear relationship.
d)
The correlation will be closer to -1 because the slope of the regression line will completely change.
10.
Which of the following have the smallest standard deviation?
a)
1 1 2 3 3
b)
3 5 5 5 7
c)
1 2 3 4 4
d)
4 5 5 5 6
11.

The distribution of magnitudes of earthquakes can be described as
a)
Roughly symmetric with a center about 1.8 and a small spread.
b)
Skewed right with a center about 2.3 and a small spread.
c)
Skewed left with a center about 2.3 and a small spread.
d)
Skewed right with a center about 1.8 and a small spread.
12.
The area under the Standard Normal Curve corresponding to -1.3<Z<2.1 is
a)
3.4
b)
.8853
c)
.8592
d)
-.5237
13.
The amount of soda in a can varies Normally with a mean of 12oz and standard deviation of 1 oz. The percent of soda in a can that is between 12 and 12.2 oz is
a)
68%
b)
34%
c)
47.5%
d)
95%
14.
The amount of soda in a can varies Normally with a mean of 12oz and standard deviation of 1 oz. The percent of cans that are considered underfilled (less than 11.9oz) is
a)
16%
b)
2.5%
c)
34%
d)
95%
15.
Events A and B are mutually exclusive (disjoint). P(A)=.3 and P(B)=.7. Which of the following is NOT true?
a)
P(A and B)=.21
b)
P(A or B) = 1.0
c)
P (A and B) = 0
d)
P(A or Not B) = .3
16.
Events A and B are independent. P(A)=.6 and the P(B)=.3. Which of the following are true?
a)
P(A & B)=.18, P(A or B)=.72
b)
P(A & B)=.72, P(A or B)=.18
c)
P(A & not B)=.18, P(A or B)=.72
d)
P(A & B)=.18, P(not A or not B)=.72
17.
Consider the five number summary: 4 7 9 12 18If there were 60 observations, how many observations were below 12?
a)
24
b)
45
c)
30
d)
20
18.

What is the probability that you pick a male who owns a sports car?
a)
21/60
b)
39/60
c)
39/240
d)
39/84
19.

What is the probability that you randomly pick someone who owns an SUV given that they are a female?
a)
135/180
b)
135/156
c)
45/84
d)
135/240
20.
Which of the following is NOT true about standard deviation?
a)
It is always non-negative.
b)
It measures the typical distance between values and the mean.
c)
If the data are in inches, it is in inches.
d)
it is very sensitive to oultiers.
21.

What does the residual plot tell you?
a)
The residual plot is good because it has a good scatter.
b)
The linear model is not appropriate because it does not have a pattern.
c)
The linear model is good because it has a good scatter.
d)
Too much data was collected because it cluttered the residual plot.
22.

What does the residual plot tell you?
a)
The residual plot is not an appropriate means for evaluating the model.
b)
The curved pattern suggest there is no association between the variables.
c)
The curved pattern suggests the linear model is not appropriate.
d)
There are not enough data points to draw any conclusions.
23.

The weight is predicted from the height using the regression line stated in the computer printout above. What is the predicted weight if the height is 64 inches?
a)
125.96 pounds
b)
54 pounds
c)
659.96 pounds
d)
-267 pounds
24.
A and B are independent. P(A)= .4 and the P(B)= .5. What is P(A or B)?
a)
.9
b)
.2
c)
.7
d)
.02
25.
The distribution of tests scores for TEST 6 was strongly skewed left. Which of the following is NOT true?
a)
The median is larger than the mean.
b)
A boxplot is best for displaying the data.
c)
The mean is larger than the median.
d)
More than 50% of the scores were above the mean.
26.
The summary stats for the last test are as follows: Mean=8.2, s=2.4, Med=8.7, IQR=2. Guy was absent the day of the test. He took it the next day and scored a 6.7. Which of the following are true?
a)
The summary stats will stay the same.
b)
The median and mean will stay the same, but the IQR and standard deviation will change.
c)
The only statistic that is guaranteed to not change is the median.
d)
We have to know more about the data to know what will happen to the summary stats.
27.
The summary stats for the last test are as follows: Mean=8.2, s=2.4, Med=8.7, IQR=2. Mrs. A decides that all tests will get 0.3 points added to their tests. Which of the following are NOT true?
a)
The mean will increase to 8.5.
b)
The median will increase to 9.0
c)
The IQR will increase to 2.3
d)
The standard deviation will stay the same.
28.
17 children are in a room. The oldest one has a birthday and is now 10. Which of the following is true?
a)
The IQR of their ages will increase by one.
b)
The median of their ages will not change.
c)
The mean of their ages will increase by one.
d)
The standard deviation of their ages will get smaller.
29.
Events A and B are independent. P(A)=.6 and P(A∩B)=.18. What is P(B)?
a)
P(B)=.03
b)
P(B)= - .42
c)
P(B) = .3
d)
P(B) = .78
30.
Consider ANY the purpose of a residual plot. Which of the following is true?
a)
If the residual plot has a pattern, it is not good for predicting.
b)
If the residual plot does not have a pattern, it is good for predicting.
c)
If the residual plot has a pattern, the model is good for predicting.
d)
If the residual plot does not have a pattern, the model is good for predicting.
31.
Consider the five number summary: 2 5 12 13 14. Which of the following is NOT true?
a)
25% of the data lies above 13.
b)
50% of the data lies between 2 and 13.
c)
50% of the data lies below 12.
d)
The distribution is skewed.
32.
The correlation between height and reading scores in elementary schools is .72. Which of the following is the most accurate interpretation of the correlation?
a)
There is a strong, positive, relationship between height and reading score. The form is most likely curved.
b)
There is a strong, positive relationship between height and reading score, but we don't know the form.
c)
There is a strong, positive, linear relationship between height and reading score.
d)
There is a weak, positive relationship between height and reading score because of the lurking variable of age.
33.

Consider the cumulative relative frequency plot. Martin placed in the 60th percentile. About what mark did he receive?
a)
80
b)
60
c)
90
d)
75
34.
The batting average for the Dodgers was .249 with a standard deviation of .014. What percent of Dodgers hit below .207?
a)
16%
b)
34%
c)
0.15%
d)
2.5%
Reset

