
 Worksheets
Unit 2 Review: Supply and Demand
Total questions: 33
Worksheet time: 17mins
Name
Class
Date
1.
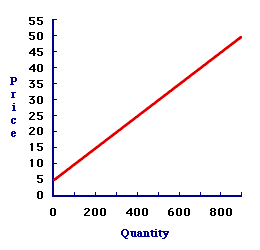
What does this curve represent?
a)
demand
b)
supply
c)
equilibrium
d)
shortage
2.
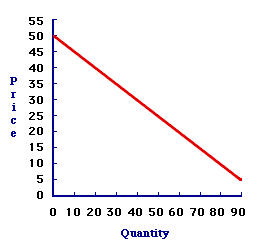
What does this curve represent?
a)
supply
b)
equilibrium
c)
demand
d)
surplus
3.
An increase in the price of aspirin is likely to be paired with a(n) ___________________ in the demand for Tylenol because the two goods are __________________.
a)
increase; complements
b)
increase; substitutes
c)
decrease; complements
d)
decrease; substitutes
4.
If the price of printers goes down, what happens in the market for ink cartridges?
a)
Supply increases.
b)
Supply decreases.
c)
Demand increases.
d)
Demand decreases
5.
Printers and ink cartridges are typically purchased together. Economists would call these
a)
Stubstitues
b)
Complements
c)
Elastic
d)
Inelastic
6.
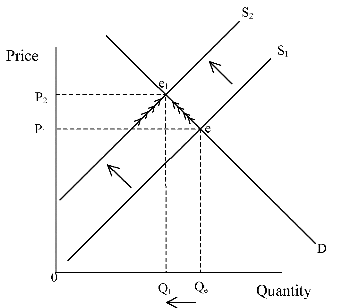
Assume the image is showing the market for apples. Which of the headlines could indicate the pictured shift is occurring in the market?
a)
Pesticides on apples linked to mouth cancer.
b)
Storms destroy apple orchards.
c)
An apple a day really does keep the doctor away.
d)
New genetic strain leads to apple trees that produce twice as many apples.
7.
A government payment made to a business is a
a)
tax
b)
regulation
c)
subsidy
d)
resource
8.
The following is a factor that will not cause the demand curve to shift:
a)
Advertising
b)
Population
c)
Price
d)
Consumer expectations
9.
A change in quantity demanded is shown
a)
at various points on the demand curve
b)
with a new demand curve drawn above or below the original demand curve
c)
with a vertical line
10.
In a market economy, who decides on the prices of goods and services?
a)
government
b)
buyers and sellers
c)
firms
d)
local leaders
11.
Generally speaking, the lower the price, the greater the quantity demand.
a)
True
b)
False
12.
For the law of demand, as price rises, what happens to quantity demanded?
a)
it goes up
b)
it goes down
c)
it stays the same
d)
it is not effected
13.
For the law of supply, as price rises, what happens to quantity supplied?
a)
it goes up
b)
it goes down
c)
it stays the same
d)
it is not effected
14.
If Michael Jordan did advertisements for Steak and Shake, this would cause the ___________ curve for Steak and Shake to shift ____________.
a)
demand.........right
b)
demand.........left
c)
supply.......right
d)
supply....... left
15.
the money a business gets from selling a good or service
a)
revenue
b)
trade-off
c)
fixed cost
d)
opportunity cost
16.
an expense that does not change no matter how much a business produces
a)
fixed cost
b)
total cost
c)
revenue
d)
benefit-cost analysis
17.
an expense that changes depending on how much a business produces
a)
variable cost
b)
total cost
c)
marginal cost
d)
fixed cost
18.
the sum of all fixed and variable costs
a)
total cost
b)
marginal cost
c)
fixed cost
d)
benefit-cost analysis
19.
the additional income received from selling one more unit of something
a)
marginal revenue
b)
marginal cost
c)
variable cost
d)
trade-off
20.
the additional expense of producing one more unit of something
a)
marginal cost
b)
marginal revenue
c)
variable cost
d)
opportunity cost
21.
Production cost that varies as output changes; labor, energy, raw materials
a)
variable cost
b)
marginal cost
c)
total cost
d)
fixed costs
22.
Principle that more will be offered for sale at higher prices than at lower prices.
a)
Stages of Production
b)
Market Supply
c)
Law of Demand
d)
Law of Supply
23.
Advances in technology usually
a)
lower costs and increase supply at all price levels.
b)
increase cost and increase supply at lower price levels.
c)
lower costs and increase supply at higher price levels.
d)
increase cost and decrease supply at all price levels.
24.
A surplus typically indicates that
a)
government price controls are needed.
b)
the market is in equilibrium.
c)
the price is too high.
d)
suppliers cannot meet the demand.
25.
What are the three economic questions all societies must answer?
a)
what, how, and for whom to produce
b)
when, where, and how to produce
c)
where, why, and how many to produce
d)
why, what, and where to produce
26.
The point where supply and demand curves meet is
a)
the disequilibrium price.
b)
the equilibrium price.
c)
the shortage price.
d)
the surplus price.
27.
All other factors remain unchanged/are held constant/ are equal is:
a)
Vice Versa
b)
Carpe Diem
c)
Elasticity
d)
Ceteris Paribus
28.
What is created when prices are too low?
a)
surplus
b)
shortage
c)
equilibrium price
d)
subsidy
29.
What determines price & quantity produced of goods?
a)
supply
b)
demand
c)
consumers
d)
supply & demand
30.

What is the Equilibrium Price?
a)
1
b)
2
c)
3
d)
4
31.

What is the Equilibrium Quantity?
a)
50
b)
60
c)
70
d)
80
32.
What is always on the Y-axis of a Supply & Demand graph?
a)
Supply
b)
Quantity
c)
Price
d)
Demand
33.

What does this graph show?
a)
Shortage
b)
Surplus
c)
Supply Table
d)
Equilibrium
100 %

