Worksheets
Functions, Slope and Scatter Plots
Total questions: 75
Worksheet time: 3hrs 14mins
A relationship between two quantities in which the ratio of one quantity to the other quantity is constant and the graph of the relationship goes through (or begins) at the origin.
Proportional Relationship
Nonlinear Relationship
Nonproportional Relationship
Linear Relationship
A measure of the steepness of a line on a graph; the rise divided by the run.
Slope
Rate of Change
Unit Rate
Linear Equation
An equation whose solutions form a straight line on a coordinate plane.
Linear Equation
Linear
Function
Slope-intercept form of an Equation
The y-coordinate of the point where the graph of a line crosses the y-axis.
Y-intercept
Slope
Domain
X-intercept
A linear equation written in the form y=mx+b, where m represents the slope and b represents the y-intercept.
Slope-intercept form of an Equation
Linear Equation
Linear Function
Relation
A set of data is the made of two paired variables.
Bivariate Data
Input
Relation
Function
An input-output relationship that has exactly one output for each input.
Function
Function Notation
Function Table
Linear Function
A table of ordered pairs that represent solutions of a function.
Function Table
Function Notation
Linear Function
Function
The value substituted into an expression or function.
Input
Output
Y-intercept
X-intercept
The value that results from the substitution of a given input into an expression or function.
Output
Input
Domain
Independent Variable
A function whose graph is a straight line.
Linear Function
Nonlinear Function
Function
Function Table
The output of a function; a variable whose value depends on the value of the input, or independent variable.
Dependent Variable
Independent Variable
Input
Domain
The set of all possible input values of a function.
Domain
Range
Output
Dependent Variable
The input of a function; a variable whose value determines the value of the output, or dependent variable.
Independent Variable
Dependent Variable
Output
Function
A function whose graph is not a straight line.
Nonlinear Function
Linear Function
Proportional Relationship
Nonproportional Relationship
The set of all possible output values of a function.
Range
Domain
Input
Independent
A set of ordered pairs.
Relation
Function
Range
Domain
The vertical change when the slope of a line is expressed as the ratio of "rise over run".
Rise
Run
Range
Independent Variable
The horizontal change when the slope of a line is expressed as the ratio of "rise over run".
Run
Rise
Range
Output
A test used to determine whether a relation is a function. If any vertical line crosses the graph of a relation more than once, the relation is not a function.
Vertical Line Test
Mapping Diagram
Function
Linear Function
A test used to represent the relationship between input and output values; the test reveals a function if each input value is paired with only one output value.
Mapping Diagram
Vertical Line Test
Function
Direct Variation
The x-coordinate of the point where the graph of a line crosses the x-axis.
X-Intercept
Y-Intercept
Range
Dependent Variable
Which set of values is a function?
(9,5) (10,5) (9,-5) (10,-5)
(3,4) (4,-3) (7,4) (3, 8)
(6,-5) (7, -3) (8, -1) (9, 1)
(2, -2) (5, 9) (5, -7) (1, 4)


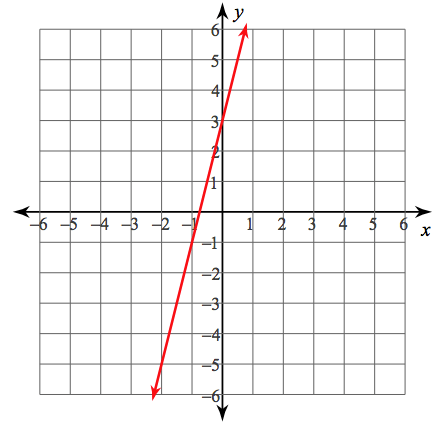


(-4, 7) and (-6, -4)
(5, -10) and (5, -4)
(-3, -4) and (7, 6)