
 Worksheets
Fall ACP Review - Definitions and Graphs
Total questions: 40
Worksheet time: 17mins
If an object has a velocity of -v, it means that it is
slowing down
speeding up
moving in the negative direction
This the the distance and direction of an object's change in position from a starting point
Displacement
Distance
Motion
Reference point
Velocity

Two people walk across a parking lot. Their paths are shown in the image. Who traveled a larger distance?
Person A
Person B
They both went the same distance


A position vs. time graph shows an object's
frame of reference
position and speed
position
speed


On a position vs. time graph, the steeper the slope, _____
the slower the speed
the faster the speed
less acceleration
greater acceleration
Calculate the speed of the object from this position vs. time graph
10 m
10 m/s
10

What is this object doing
Moving away from origin at constant speed, then stopping, then going back to its starting point at constant speed
Speeding up in positive direction, then maintaining constant speed, then decelerating until it stops.
Increasing, stopping, decreasing
What is this object doing between 0 and 4 seconds?
Moving away from origin at constant speed
Accelerating
Increasing
How fast is the object moving between 0 and 4 seconds?
Can't tell
Anywhere between 0 and 8 m/s
2 m/s
How much is the object acceleration between 0 and 4seconds?
Can't tell
8 m/s2
2 m/s2
0 m/s2
How much is the object acceleration between 4 and 7 seconds?
Can't tell
8 m/s2
2 m/s2
0 m/s2
Acceleration is
change in velocity over time
change in position over time
speeding up or slowing down
Two people walk across a parking lot. Their paths are shown in the image. Who traveled with a larger displacement?
Person A
Person B
They both had the same displacement.
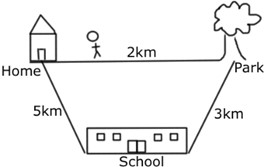
Jerry walked from home to school (south), then from the school to the park (north). What is his total displacement?
2 km East
5 km South
8 km East
2 km
8 km

At 60 seconds, how far had this object traveled away from its starting point?
0 m
10 m
20 m
40 m


What is the total displacement of the object represented in this motion graph?
5 meters
4 meters
2 meters
0 meters
What is the total distance of the object represented in this motion graph?
5 meters
4 meters
2 meters
0 meters
How fast did the object move away from the starting point between 0 sec and 4 sec?
0.5 meters every second
0.5 meters
4 meters every second
4 meters
2 meters every second
How fast did the object move back towards the starting point between 4 sec and 8 sec?
0.25 meters every second
- 0.25 meters every second
4 meters every second
- 4 meters every second

How fast did the object move between 0 and 20 s?
50 m/s
2.5 m/s
0.4 m/s
100 m
50 m
How fast did the object move between 20 and 30 s?
0 m
0 m/s
10 m
10 m/s
Generally speaking in physics, moving forward is _______________, moving backwards is ____________
negative; positive
positive; negative
derp; derper


Which velocity graph matches this position graph from 20 to 30 seconds?


Which velocity graph matches this position graph from 30 to 40 seconds?

Which V v T graph matches this P v T graph?


Calculate the slope of this best-fit line
0.4
2.5
1
0.6

Calculate the slope of this best-fit line
-2
2
-1.67
-0.6

This graph shows the speed of a car during 6 seconds. How far did the car travel (displacement) during the last 2 seconds (4 - 6 s)?
10 m
20 m
10 m/s
20 m/s
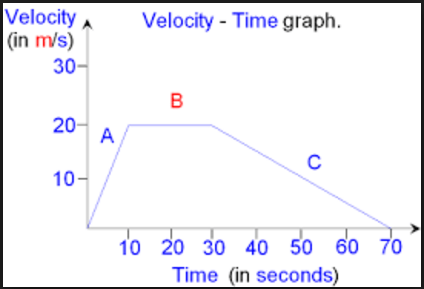
This is a velocity-time graph: What is the displacement of the object between 0 and 30 seconds? (area under curve)
600 m
0 m
500 m
0.67 m

Which of the following is true about the motions of objects A and B at t = 4 seconds? (Check all that apply)
Both objects have the same speed.
Both objects have the same velocity.
Both objects have the same position
Object A is passing object B

How far did the object travel (displacement) between 10 - 12 seconds?
2 m
0 m
-4 m

