
 Worksheets
Statistics Unit Review
Total questions: 67
Worksheet time: 3hrs 52mins






Describe the shape of the graph.
Symmetrical
Skewed
Uniform

Describe the shape of Daniel's data
skewed
uniform
symmetrical

21. How many students are represented by the histogram?
Cannot be determined
9
31
35

What is the class width for this frequency table?
4
5
10
25
For which of the following variables would it be most appropriate to construct a histogram?
Television brand
Insect species
Gender
Eye color
Phone call length

A random sample of students was given five minutes to solve as many short puzzles as possible. The results by gender are displayed in the dotplots. Which of the following is FALSE statement?
75% of girls finished 4 or more puzzles
The distribution of female scores is skewed right.
The distribution of male scores is roughly symmetric.
Both distributions are unimodal.
Females performed better on the challenge of solving short puzzles in the five minutes allotted.

Which of the following is NOT true about the graph?
Potential outlier
Centered at about 35
skewed right
not symmetric

Which of the following is NOT true about the graph?
symmetric
bimodal
centered at about 10
range of 10

A random sample of grocery shoppers were asked whether or not they support higher speeding fines in town. A reporter concludes that more females than males support higher fines. Is he correct in his reasoning?
Yes. 62 is greater than 45.
Yes. More females than males participated in the study.
No. A higher percentage of males than females supported higher fines.
No. Fewer males than females participated in the study.
How many students got an ACT composite score of 22?
Cannot be determined
9
31
35



42, 58, 67, 55, 40, 69, 66, 51, 46, 48, 68
42, 58, 67, 55, 40, 69, 66, 51, 46, 48, 68
14, 11, 8, 1, 23, 20, 17, 5, 19, 10, 12, 22
14, 11, 8, 1, 23, 20, 17, 5, 19, 10, 12, 22
14, 11, 8, 1, 23, 20, 17, 5, 19, 10, 12, 22
107, 92, 111, 119, 99, 100, 89, 94, 125, 93


How do you find the interquartile range?
Add Q3 and the max
Subtract Q1 from Q3 to find the interquartile range.
Add the max and the min
Subtract the median from Q3 to find the interquartile range




$8
$12
$24
$28

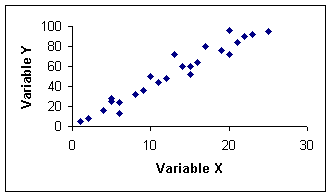

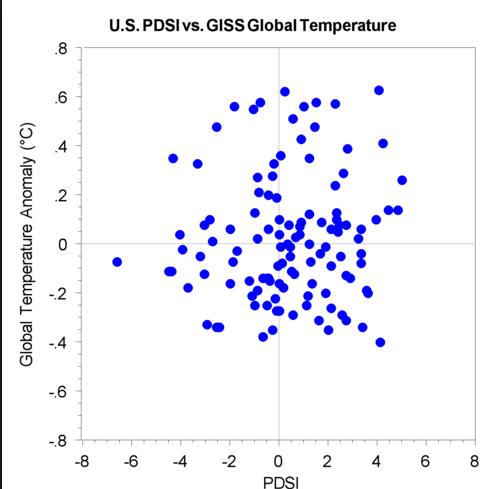

Determine the correlation coefficient of the given data:
.9820
-.9643
-1.409
.164


y = 0.5x + 1
y = 0.03x + 0.95
y = 0.3x + 0.96
y = 0.96x + 0.03

