
 Worksheets
Motion Graphs
Total questions: 33
Worksheet time: 8hrs 15mins
Name
Class
Date
1.

This graph demonstrates an object that is -
a)
Increasing speed
b)
At a constant speed
c)
Decreasing speed
d)
Stationary
2.
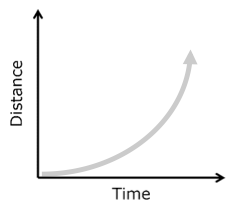
This graph demonstrates an object that is -
a)
Increasing speed
b)
At a constant speed
c)
Decreasing speed
d)
Stationary
3.

This graph demonstrates an object that is -
a)
Increasing speed
b)
At a constant speed
c)
Decreasing speed
d)
Stationary
4.

This graph demonstrates an object that is -
a)
Increasing speed away from the start
b)
Moving away from the start at a constant speed
c)
Decreasing speed toward the start
d)
Moving toward the start at a constant speed
5.
This graph demonstrates an object that is -
a)
Increasing speed
b)
At a constant speed
c)
Decreasing speed
d)
Stationary
6.

This graph demonstrates an object that is -
a)
Increasing speed toward the start
b)
Moving away from the start at a constant speed
c)
Decreasing speed away from the start
d)
Moving toward the start at a constant speed
7.

Which line represents an object moving at a faster speed?
a)
A
b)
B
8.
Which line represents an object moving at a slower speed?
a)
A
b)
B
9.

This graph demonstrates an object that is -
a)
At a constant speed
b)
Increasing speed
c)
Decreasing speed
d)
Stationary
10.

This graph demonstrates an object that is -
a)
At a constant speed
b)
Increasing speed
c)
Decreasing speed
d)
Stationary
11.

This graph demonstrates an object that is -
a)
At a constant speed
b)
Increasing speed
c)
Decreasing speed
d)
Stationary
12.

This graph demonstrates an object that is -
a)
At a constant speed
b)
Increasing speed
c)
Decreasing speed
d)
Stationary
13.

Which graph is showing acceleration (getting faster)
a)
D
b)
E
c)
both D and E
d)
neither D or E
14.
Which graph is showing deceleration (getting slower)
a)
D
b)
E
c)
both D and E
d)
neither D or E
15.
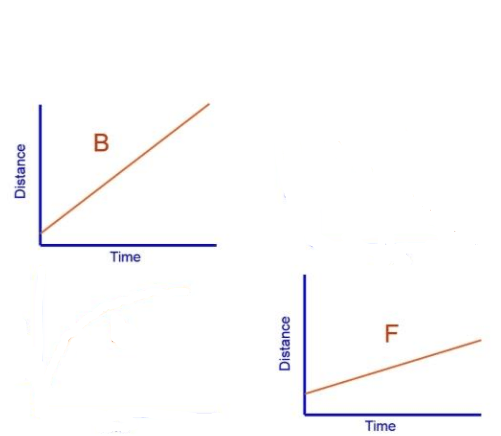
Which graph is showing a faster constant speed?
a)
B
b)
F
c)
They show the same speed
16.

At 60 seconds, how far had this object traveled?
a)
0 m
b)
10 m
c)
20 m
d)
40 m
17.

What is the speed this motion?
a)
constant speed
b)
not moving
c)
speed increasing
d)
speed increasing at a constant rate
18.

What happened during A to B point?
a)
not moving
b)
increasing speed at a constant rate
c)
moving at a constant speed
d)
acceleration
19.

What happened during C to D point?
a)
not moving
b)
increasing speed at a constant rate
c)
moving at a constant speed
d)
moving at 0 m/s2 acceleration
20.

What happened during E to F point?
a)
not moving
b)
increasing speed at a constant rate
c)
constant speed
d)
acceleration
21.

What happened during B to C point?
a)
deceleration
b)
constant speed
c)
at rest
d)
acceleration
22.

What kind of acceleration is shown here?
a)
positive
b)
negative
c)
none
d)
varies
23.

What kind of acceleration is shown here?
a)
positive
b)
negative
c)
none
d)
varies
24.

What kind of acceleration is shown here?
a)
none
b)
positive
c)
negative
d)
varies
25.

What is the velocity?
a)
not moving
b)
increasing
c)
positive
d)
negative
26.

What is the velocity?
a)
0 m/s
b)
positive m/s
c)
negative m/s
d)
decreasing
27.

Is the speed constant or non-constant?
a)
constant
b)
non-constant
28.

Is the speed constant or non-constant?
a)
constant
b)
non-constant
29.

Is the speed constant or non-constant?
a)
constant
b)
non-constant
30.

Is the speed constant or non-constant?
a)
constant
b)
non-constant
31.

Which section of the graph shows decreasing velocity?
a)
CD
b)
DE
c)
EF
d)
GH
32.

Which section of the graph shows increasing velocity?
a)
AB
b)
BC
c)
DE
d)
EF
33.
Which of these is an example of negative acceleration, or deceleration?
a)
a bird taking off for flight
b)
a roller coaster moving down a steep hill
c)
a car approaching a red light
d)
an airplane following a straight flight path
100 %

