
 Worksheets
APS Midterm Quiz Ch 1-3 2019-20
Total questions: 125
Worksheet time: 8hrs 47mins
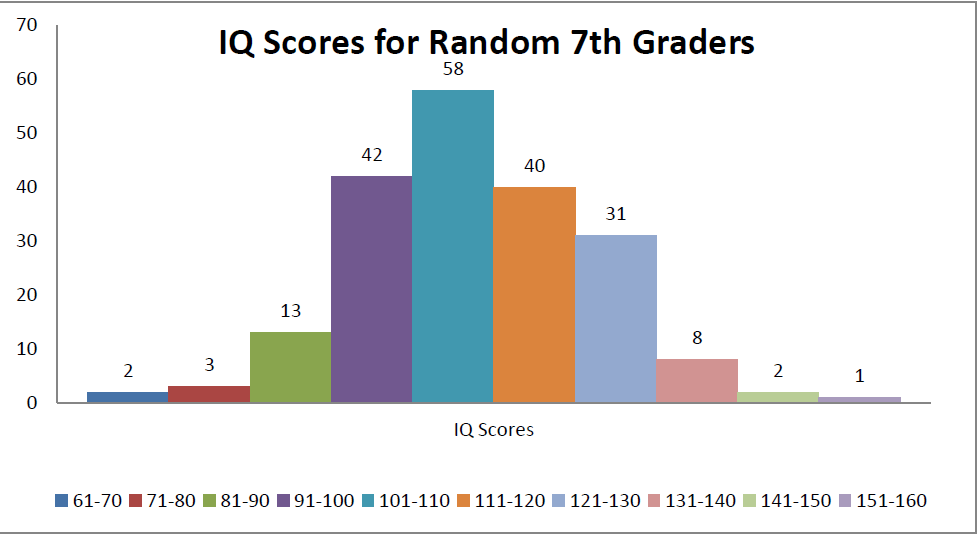
Calculate the relative frequency of having an IQ score in the 131-140 range. (200 7th graders were surveyed).
8%
4%
20%
15.5%

Calculate the 5 number summary for the following data. You may use your graphing calculator.
1791, 3162, 6163, 8578, 9400
1791, 3815, 6472, 8924.5, 9400
6197.44
7609
On a recent test, one class of 26 students had a mean score of 78%, while another class of 32 students had a mean score of 86%. What is the overall mean of the two classes combined?
82
82.4
81
83

(draw a line down the middle and both sides look the same)

Which measure of central tendency best represents this data?
Mean
Median
Mode
Range
What percent of data lies within 1 standard deviation from the mean?
95%
99%
68%
100%
You have a mean of 56 and a standard deviation of 4.3. What is +2 standard deviations from the mean?
60.3
47.4
51.7
64.6
The negative standard deviations on a normal distribution curve mean what?
Below average
Above average
Average
A beverage company wanted to see if people in the United States liked their new logo. Which choice best represents a population?
A selection of logo artists.
Every person in the United States.
A selection of shoppers from different states.
3,800 children age 5 - 15
A musician wanted to see what people who bought his last album thought about the songs. Which choice best represents a sample? .
Every person who bought the album.
A selection of people who didn't want to buy the album.
250 girls who bought the album
A selection of 3,294 people who bought the album.
A gaming website wanted to find out which console its visitors owned. Which choice best represents a population?
Visitors to the 3DS section.
All of the website visitors.
Visitors to the PS4 section.
Visitors who are on the website for more than 5 minutes.


Let the random variable X represent the weight of male black bears before they begin hibernation. Research has shown that X is approximately Normally distributed with a mean of 250 pounds and a standard deviation of 50 pounds. What is the probability of a bear weighing more than 325 pounds, P(X > 325 pounds)?
0.0668
0.2514
0.7486
0.8531

2, 4, 7, 8, 9, 12, 14, 18, 19, 21, 30, 32
Which box plot correctly summarizes the data?
What is the probability the next male long jumper from State College jumps longer than 270 inches?
How far did a male long jumper for State College jump if his jump was 1.68 standard deviations below the mean?
Suppose a male long jumper's jump ranked in the 50th percentile. How far did he jump?
If a male long jumper from State College jumps 265 inches, what percentile does he fall in?
If a male long jumper from State College jumps 270 inches, what percent of male long jumpers jumped further than him?
What is the maximum distance a male longer jumper needs to jump to be in the bottom 10% of all male long jumpers from State College?
What is the probability the next male long jumper from State College jumps between 240 and 262 inches?
What is the minimum distance a male longer jumper needs to jump to be in the top 10% of all male long jumpers from State College?

A
B
C
D
E

A
B
C
D
E

A
B
C
D
E

A
B
C
D
E

A
B
C
D
E

A
B
C
D
E

II only
I and II
I and III
II and III
I, II, and III

A
B
C
D
E

A
B
C
D
E

A
B
C
D
E


With practice, people become faster at solving a certain type of mathematical puzzle. Fourteen college students were allowed to practice completing a certain type of mathematical puzzle for different amounts of time. Afterwards, each student’s completion time on a new puzzle was measured. The Residual plot for regression of Completion Time on Practice Time is shown below. Which of the following is correct?
There is a no relationship between Practice Time and Puzzle Completion Time.
This regression equation would likely overestimate the Puzzle Completion Time for 175 minutes of practice time.
There is a non-linear relationship between Practice Time and Puzzle Completion Time.


What percent of all small companies receiving questionnaires responded?


A
B
C
D
E

A
B
C
D
E

A
B
C
D
E

A
B
C
D
E

A
B
C
D
E

A
B
C
D
E

A
B
C
D
E


A child is 40 inches tall, which places her at the 90th percentile of all children of similar age. The heights for children of this age form an approximately Normal distribution with a mean of 38 inches. Based on this information, what is the standard deviation of the heights of all children of this age?
0.20 inches
0.31 inches
0.65 inches
1.21 inches
1.56 inches
A large set of test scores has mean 60 and standard deviation 18. If each score is doubled, and then 5 is subtracted from the result, the mean and standard deviation of the new scores are
mean 115; std. dev. 31.
mean 115; std. dev. 36.
mean 120; std. dev. 6.
mean 120; std. dev. 31.
mean 120; std. dev. 36.
For a biology project, you measure the weight in grams (g) and the tail length in millimeters (mm) of a group of mice. The equation of the least-squares line for predicting tail length from weight is
predicted tail length = 20 + 3(weight)
Which of the following is not correct?
The slope is 3, which indicates that a mouse’s weight should increase by about 3 grams for each additional millimeter of tail length.
The predicted tail length of a mouse that weighs 38 grams is 134 millimeters.
By looking at the equation of the least-squares line, you can see that the correlation between weight and tail length is positive.
If you had measured the tail length in centimeters
instead of millimeters, the slope of the regression
line would have been 3/10 = 0.3.
One mouse weighed 29 grams and had a tail length of
100 millimeters. The residual for this mouse is −7.

The figure above shows a Normal density curve. Which of the following gives the best estimates for the mean and standard deviation of this Normal distribution?
mean=200, s.d.=50
mean=200, s.d.=25
mean=225, s.d.=50
mean=225, s.d.=25
mean=225, s.d.=277
The owner of a chain of supermarkets notices that there is a positive correlation between the sales of beer and the sales of ice cream over the course of the previous year. During seasons when sales of beer were above average, sales of ice cream also tended to be above average. Likewise, during seasons when sales of beer were below average, sales of ice cream also tended to be below average. Which of the following would be a valid conclusion from these facts?
Sales records must be in error. There should be no
association between beer and ice cream sales.
Evidently, for a significant proportion of customers of
these supermarkets, drinking beer causes a desire for
ice cream or eating ice cream causes a thirst for beer.
A scatterplot of monthly ice cream sales versus
monthly beer sales would show that a straight line
describes the pattern in the plot, but it would have
to be a horizontal line.
There is a clear negative association between beer
sales and ice cream sales.
The positive correlation is most likely a result of
the variable temperature; that is, as temperatures
increase, so do both beer sales and ice cream sales.
Here are the IQ scores of 10 randomly chosen fifth- grade students:
145 139 126 122 125 130 96 110 118 118
Which of the following statements about this data set is not true?
The student with an IQ of 96 is considered an
outlier by the 1.5 × IQR rule.
The five-number summary of the 10 IQ scores is
96, 118, 123.5, 130, 145.
If the value 96 were removed from the data set, the mean of the remaining 9 IQ scores would be greater than the mean of all 10 IQ scores.
If the value 96 were removed from the data set, the standard deviation of the remaining 9 IQ scores would be less than the standard deviation of all 10 IQ scores.
If the value 96 were removed from the data set, the IQR of the remaining 9 IQ scores would be less than the IQR of all 10 IQ scores.

The frequency table above summarizes the times in the last month that patients at the emergency room of a small-city hospital waited to receive medical attention. Which of the following represents possible values for the median and mean waiting times for the emergency room last month?
median = 27 minutes and mean = 24 minutes
median = 28 minutes and mean = 30 minutes
median = 31 minutes and mean = 35 minutes
median = 35 minutes and mean = 39 minutes
median = 45 minutes and mean = 46 minutes

Boxplots of two data sets are shown. Based on the boxplots, which statement below is true?
The range of both plots is about the same.
The means of both plots are approximately equal.
Plot 2 contains more data points than Plot 1.
The medians are approximately equal.
Plot 1 is more symmetric than Plot 2.

The area under normal curve is always 1, regardless of the mean and standard.
True
False
Many professional schools require applicants to take a standardized test. Suppose that 1000 students take such a test. Several weeks after the test, Pete receives his score report: he got a 63, which placed him at the 73rd percen- tile. This means that
Pete’s score was below the median.
Pete did worse than about 63% of the test takers.
Pete did worse than about 73% of the test takers.
Pete did better than about 63% of the test takers.
Pete did better than about 73% of the test takers.

The figure shows a cumulative relative frequency graph of the number of ounces of alcohol consumed per week in a sample of 150 adults. About what percent of these adults consume between 4 and 8 ounces per week?
20%
40%
50%
60%
80%
The average yearly snowfall in Chillyville is Nor- mally distributed with a mean of 55 inches. If the snowfall in Chillyville exceeds 60 inches in 15% of the years, what is the standard deviation?
4.83 inches
5.18 inches
6.04 inches
8.93 inches
The standard deviation cannot be computed from the given information.
If the heights of American men follow a Normal dis- tribution, and 99.7% have heights between 5′0′′ and 7′0′′, what is your estimate of the standard deviation of the height of American men?
1′′
3′′
4′′
6′′
12′′
Which of the following is not correct about a stan-
dard Normal distribution?
The proportion of scores that satisfy 0 < z < 1.5 is 0.4332.
The proportion of scores that satisfy z < −1.0 is 0.1587.
The proportion of scores that satisfy z > 2.0 is 0.0228.
The proportion of scores that satisfy z < 1.5 is 0.9332.
The proportion of scores that satisfy z > −3.0 is 0.9938.
f 30 is added to every observation in a data set, the only one of the following that is not changed is
the mean.
the 75th percentile.
the median.
the standard deviation.
the minimum.

Which of the boxplots given below has the largest IQR value? What would you estimate that range to be?
4200
3800
5500
2100
Construct a boxplot from the following data, which describes the data of a sample set of sale prices for 10 orders from Dunkin Donuts!
1.50, 10.29, 8.34, 6.60, 5.35, 4.90, 8.30, 7.25, 9.50, 10, 11.12, 12.40, 15, 20.19


Identify whether or not the following data set has any outliers, using the IQR definition of an outlier:
10.2, 14.1, 14.4. 14.4, 14.4, 14.5, 14.5, 14.6, 14.7, 14.7, 14.7, 14.9, 15.1, 15.9, 16.4
10.2 is an outlier
15.9 and 16.4 are outliers
16.4 is an outlier
10.2, 15.9, and 16.4 are outliers

A
B
C
D
E

A
B
C
D
E

A
B
C
D
E

15
30
45
60
75

13.4
13.5
13.9
14.5
17.1

Half of the students have handspans between 18.1 and 19.5 cm
Half of the students have handspans between 17.1 and 18.8 cm
Most of the students have handspans greater than 18.1 cm
Most of the students have handspans less than 19.5 cm
The 21.5 cm value is an outlier, but not the 17.1 cm value

Given this cumulative relative frequency plot, what ages would be considered outliers?
Between 20 and 25
Between 20 and 30
Between 20 and 25, or between 55 and 60
Between 20 and 30, or between 50 and 60
Between 20 and 40

These dotplots for randomly selected male and female students at a particular high school show the number of times per week they eat at fast food restaurants. Which of the following is a true statement?
One distribution is roughly symmetric; the other is skewed left.
The difference in their means is less than the difference in their medians.
The ranges are both 7.
The standard deviations are the same.
Combining the male and female times into one set of student times will increase the range to the sum of the individual ranges.
Suppose the average score on a national exam is 500 with a standard deviation of 100. If each score is increased by 20 and the result is increased by 10 percent, what are the new mean and standard deviation?
mean = 570; sd = 100
mean = 570; sd = 110
mean = 572; sd = 100
mean = 572; sd = 110
mean = 572; sd = 132
If the standard deviation of a set of observations is 0, you can conclude:
that there is no relationship between the observations.
that the average value is 0.
that all observations are the same value.
That a mistake in arithmetic has been made.
none of the above.
An AP Statistics teacher grades using z-scores. On the second major exam, a student receives a grade with a z-score of -1.3. What is the correct interpretation of this grade?
The student's grade went down 1.3 points from the first exam.
The student's grade went down 1.3 points more than the average grade went down from the first exam.
The student scored 1.3 standard deviations lower on the second exam than the first.
The student scored 1.3 standard deviations lower on the second exam than the class average on the first exam.
The student scored 1.3 standard deviations lower on the second exam than the class average on the second exam.

A: 48,60,72
B: 52,60,68
C: 56,60,64
D: 60,64,68
E: 60,72,84
Which of the following is a true statement?
All symmetric histograms have single peaks.
All symmetric bell-shaped curves are normal.
All normal curves are bell-shaped and symmetric.
All normal distributions are uniform distributions.
None of the statements are true.
Assuming that heights of professional male tennis players follow a bell-shaped distribution, arrange in ascending order:
I. A height with a z-score of 1.
II. A height with a percentile rank of 80 percent.
III. A height at third quartile.
I, II, III
I, III, II
II, I, III
III, I, II
III, II, I

Given this cumulative frequency plot, what can be said about the value of the mean?
Between 10 and 15
Between 15 and 20
20
More than 20
From such a plot, one can determine the median, but nothing can be concluded about the mean.
Suppose the scores on an exam have a mean of 75 with a standard deviation of 8. If one student has a test result with a z-score of -1.5, and a second student has a test result with a z-score of 2.0, how many points higher was the second student's result than that of the first?
3.5
4
12
16
28

Consider the 3 scatterplots. Which has the greatest correlation coefficient r ?
I
II
III
They all have the same correlation coefficient
The question cannot be answered without additional information.

Can dress size be predicted from a women's height? In a random sample of 20 female high school students, dress size versus height (cm) is summarized. What is the correct interpretation of 0.3736?
37.36 percent of the variation in dress size can be explained by this linear model relating dress size to height.
0.3736 is a measure of the variability in the set of residuals.
When using LSRL with heights to predict dress size, we will typically be off by about 0.3736 sizes.
For every 1 cm increase in height, there is a predicted increase of 0.3736 in dress size on average.
For every 1 size increase in dress size, there is a predicted increase of 0.3736 cm in height on average.
Can dress size be predicted from a women's height? In a random sample of 20 female high school students, dress size versus height (cm) is summarized. What is the correct interpretation of 4.4672?
4.4672 percent of the variation in dress size can be explained by this linear model relating dress size to height.
4.4672 is a measure of the variability in the set of residuals.
When using LSRL with heights to predict dress size, we will typically be off by about 4.4672 sizes.
For every 1 cm increase in height, there is a predicted increase of 4.4672 in dress size on average.
For every 1 size increase in dress size, there is a predicted increase of 4.4672 cm in height on average.
Can dress size be predicted from a women's height? In a random sample of 20 female high school students, dress size versus height (cm) is summarized. What is the correct interpretation of 17.7?
17.7 percent of the variation in dress size can be explained by this linear model relating dress size to height.
17.7 is a measure of the variability in the set of residuals.
When using LSRL with heights to predict dress size, we will typically be off by about 17.7 sizes.
For every 1 cm increase in height, there is a predicted increase of 17.7 in dress size on average.
For every 1 size increase in dress size, there is a predicted increase of 17.7 cm in height on average.
Can dress size be predicted from a women's height? In a random sample of 20 female high school students, dress size versus height (cm) is summarized. What is the LSRL?
predicted size = -48.81 + 0.3736(height)
predicted height = -48.81 + 0.3736(size)
predicted size = 0.3736 - 0.48.81(height)
predicted height = 0.3736 - 0.48.81(size)
predicted size = 4.4672 + 0.3736(height)
Suppose the correlation between two variables is r=0.28. What will the new correlation be if 0.17 is added to all the x-values, every value of the y-variable is doubled, and the two variables are interchanged?
.45
.56
.90
-0.28
0.28
Which of the following statements about the correlation coefficient r is INCORRECT?
It is not affected by changes in the measurement units of the variables
It is not affected by which variable is called x and which is called y.
It is not affected by extreme values
It gives information about a linear relationship, not about causation.
It always takes a value between -1 and 1, even if the association is nonlinear.
Which of the following statements about residuals is INCORRECT?
The mean of the residuals is always zero.
The sum of the residuals is always zero.
The regression line for a residual plot is a horizontal line.
The standard deviation of the residuals gives a measure of how the points in the scatterplot are spread around the regression line.
A residual equals the predicted y minus the observed y.
Consider the three points (4,33), (5,27), and (6,15). Given any straight line, we can calculate the sum of the squares of the three vertical distances from these points to the line. What is the smallest possible value this sum can be?
2.45
6
8.66
36
none of these

A
A
B
C
D
E
Consider the points (-1,4), (2,10), (4,15), (7,21), (10,n). What should n be so that the correlation between the x an y values is r=1 ?
26
27
28
A value different than any of these.
No value for n can make r = 1.

The number of students taking AP Statistics at a high school during the years 2000-2007 is fitted with a least squares regression line. The graph of the residuals and some computer out is given. How many students took AP Statistics in the year 2003?
47
48
52
53
58

