
 Worksheets
Ecology
Total questions: 37
Worksheet time: 48mins
Name
Class
Date
1.

In the energy pyramid here, how much of the energy in the producers gets passed to the herbivores?
a)
10%
b)
20%
c)
80%
d)
90%
2.
Which of the following leads to a decrease in biodiversity?
a)
protection of ecosystems
b)
pollution control
c)
selective cutting
d)
introduction of exotic or invasive species
3.

In the food web shown, the snail would be considered...
a)
primary consumer
b)
secondary consumer
c)
tertiary consumer
d)
producer
4.
What is the original source of almost all energy in most ecosystems?
a)
carbohydrates
b)
sunlight
c)
water
d)
carbon
5.

which symbiosis is this
a)
parasitism
b)
mutualism
c)
commensalism
d)
nonalism
6.

symbiotic relationship in which one organisms benefits and the other organism is not affected
a)
invasive (non-native) species
b)
mutualism
c)
nitrogen fixation
d)
commensalism
7.
An increase in the atmospheric levels of carbon dioxide (CO2) is the biggest contributor to which of the following?
a)
El Nino
b)
global warming
c)
wind storms
d)
ozone depletion
8.
Which human activity has had the greatest impact on climate change?
a)
building skyscrapers
b)
deforestation
c)
burning fossil fuels
d)
production of nuclear waste
9.
Grazing cows disturb the grass and cause insects to fly around the cows as they eat. In turn, birds swoop in and eat the insects. This type of feeding relationship is an example of
a)
commensalism.
b)
mutualism.
c)
parasitism.
d)
predation.
10.

The image shown is an example of _______
a)
Parasitism
b)
Commensalism
c)
Mutualism
d)
Communism
11.
Anything that can decrease the size of a population including living (biotic) and non living (abiotic) features of an ecosystem such as predators and drought.
a)
limiting factor
b)
habitat
c)
ecosystem
d)
carrying capacity
12.
Which kind of growth does the human population follow? It is described as a J-shaped curve.
a)
Exponential Growth
b)
Logistic Growth
c)
Outstanding Growth
d)
Minimal Growth
13.

What point on the graph represents the carrying capacity?
a)
A
b)
B
c)
C
d)
D
14.

Levels of ecological organization in order from largest to smallest would be _____.
a)
species, population, community, ecosystem, biome, biosphere
b)
biosphere, biome, ecosystem, community, population, species
c)
biosphere, biome, ecosystem, population, community, species
d)
population, species, community, biome, biosphere,
15.

What type of symbiotic relationship exists between this sea turtle and the barnacles attached to his shell? (the turtle doesn't care)
a)
competition
b)
commensalism
c)
parasitism
d)
mutualism
16.

What is happening at 1 of the carbon cycle pictured here?
a)
respiration: releasing CO2
b)
decomposing CO2 in the soil
c)
photosynthesis: absorbing CO2
d)
turning CO2 from the atmosphere into organic molecules
17.
Toxins accumulate in the tissues of organisms as they pass through a food chain/web.
a)
eutrophication
b)
biomagnification
c)
ecological succession
d)
symbiosis
18.
Which of the following results when nitrogen and sulfur-containing compounds mix with water in the atmosphere?
a)
global warming
b)
ozone depletion
c)
acid rain
d)
thermal pollution
19.
What is global warming?
a)
the steady rise of earth's daily temperature
b)
the rapid rise of Earth's average temperature
c)
the steady rise of the United States' daily temperature
d)
the rapid rise of the United States' average temperature
20.
A species that is not native to an area is called:
a)
Native Species
b)
Natural Species
c)
Invasive Species
d)
Symbiotic Species
21.
Which of these sets of three items produce CFCs
a)
cars, factories, and cardboard
b)
spray cans, cardboard, insulation
c)
spray cans, refrigerant, cardboard
d)
spray cans, refrigerant, insulation
22.
What are some consequences of deforestation?
a)
increased population in cities
b)
building of more infrastructure
c)
soil erosion, loss of ability of trees to remove CO2 from the atmosphere
d)
more mercury and cyanide released into rivers
23.

What does this image represent?
a)
bioaccumulation
b)
biomagnification
c)
eutrophication
d)
ocean acidification
24.

How does carbon in a grass plant get into a lion?
a)
The lion eats an antelope that ate the grass
b)
Carbon from grass doesn't end up in a lion.
c)
The lion absorbs the carbon given off by transpiration
d)
The lion breathes in carbon given out by the plant
25.
Individuals of a population who exit an area.
a)
Immigration
b)
Emigration
c)
Mitigation
d)
Lingation
26.
When humans burn fossil fuels, most of the carbon quickly enters the as carbon dioxide.
a)
Water
b)
Atmosphere
c)
Sun
d)
Air
27.

What is this a picture of?
a)
Nitrogen cycle
b)
carbon cycle
c)
water cycle
d)
plant cycle
28.
After plants and animals contain nitrogen, what puts it back into atmosphere and soil?
a)
decomposition
b)
precipitation
c)
condensation
d)
bacteria
29.
Organisms require nitrogen to make which of the following?
a)
glucose and starch
b)
lipids and nucleic acids
c)
proteins and nucleic acids
d)
carbohydrates and proteins
30.
Birds eat the flies off of a rhino's back in the savannah
a)
commensalism
b)
Mutualism
c)
parasitism
31.
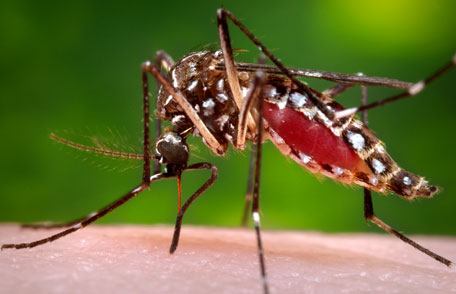
When a mosquito bites you, you are the __________ and the mosquito is the ____________.
a)
host, hostess
b)
parasite, host
c)
host, parasite
d)
prey, predator
32.
What type of symbiosis?
* Hummingbirds feed on nectar from flowers.
* Flowers are pollinated by hummingbirds as they move from flower to flower.
* Hummingbirds feed on nectar from flowers.
* Flowers are pollinated by hummingbirds as they move from flower to flower.
a)
commensalism
b)
mutualism
c)
parasitism
d)
predation
33.

How would you describe the population?
a)
Growing
b)
Steady (not much change)
c)
Decreasing
d)
Rapid growth
34.
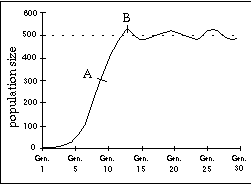
What is the carrying capacity of the graph?
a)
around 500
b)
more than 500
c)
less than 500
d)
around 600
35.
How do animals get nitrogen?
a)
the atmosphere
b)
eating other organisms
c)
bacteria
d)
lightning
36.

The diagram represents a pyramid of energy in an ecosystem. Which level would most likely contain members of the plant kingdom?
a)
A
b)
B
c)
C
d)
D
37.

Which level has the most energy available?
a)
producer
b)
primary consumer
c)
secondary consumer
d)
tertiary consumer
100 %

