
 Worksheets
APS - Motion
Total questions: 45
Worksheet time: 2hrs 38mins
A vector is a quantity that has magnitude and no direction
True
False
The rate of change in velocity; how quickly velocity is changing
speed
velocity
resultant speed
acceleration
The unit for acceleration is
m2/s
m/s
m/s2
m/s3
If velocity and acceleration are in the same direction an object ____________.
speeds up
slows done
stops
turns
If velocity and acceleration are in the opposite direction, the object _________.
stops
none
slows down
speeds up
Acceleration due to gravity is (a) m/s/s.
A car moving at 80 mph has a velocity of -35.8 m/s. What acceleration would it have if it took 5.0 s to come to a complete stop?
6.16 m/s/s
-3.12 m/s/s
7.16 m/s/s
-7.16 m/s/s
If a ferrari, with an initial velocity of 10 m/s, accelerates at a rate of 50 m/s2 for 3 seconds, what will its final velocity be?
170 m/s
140 m/s
150 m/s
160 m/s
An object falls from a building. How long will it take before it reaches a speed of 50 m/s?
5s
-5s
4s
-4s
What is the acceleration of a car that travels in a straight line at a constant speed?
0 m/s/s
9.8 m/s/s
4 m/s/s
2 m/s/s
A ball is dropped at the top of building. After 2 seconds it's velocity is measured to be 20 m/s. What is its acceleration?
20 m/s/s
10 m/s/s
0 m/s/s
30 m/s/s
In which of the following conditions does the car not accelerate?
A car moves at 80 km/h on a flat, straight highway
the car slows down from 80 km/h to 35 km/h
the car turns acorner
the car speeds up from 35 km/h to 80 km/h
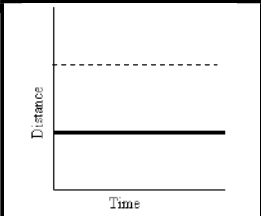
What does the solid line on this graph represent?
Constant speed
Acceleration
At rest
deceleration
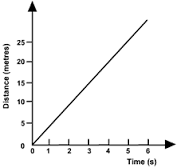
What is the line on this graph showing?
moving away from starting point at a constant speed
moving back towards the starting point at a constant speed
acceleration (speeding up)
acceleration (slowing down)
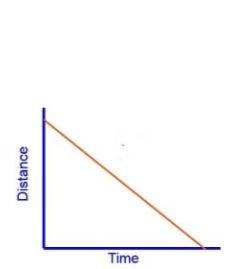
What is this line of this graph showing?
moving away from starting point at a constant speed
moving back towards the starting point at a constant speed
acceleration (getting faster)
deceleration (getting slower)

Which graph shows the object speeding up?
D
E
both D and E
neither D or E
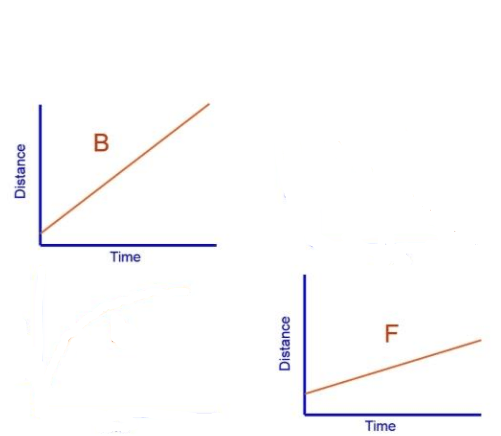
Which graph is showing a faster constant speed?
B
F
They show the same speed

How long did it take this object to travel 10 m?
0 s
10 s
15 s
20 s

At 60 seconds, how far had this object traveled?
0 m
10 m
20 m
40 m

What happened during A to B point?
not moving
increasing speed at a constant rate
moving at a constant speed
acceleration

What happened during C to D point?
not moving
increasing speed at a constant rate
moving at a constant speed
moving at 0 m/s2 acceleration

What happened during E to F point?
not moving
increasing speed at a constant rate
constant speed
acceleration

What happened during B to C point?
slowing down
constant speed
at rest
speeding up
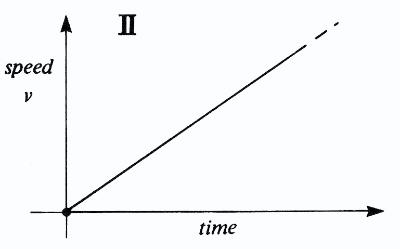
what is the motion described in the graph
all of above
constant speed
acceleration
constant position
When does this object change direction?
20 s
40 s
60 s
100 s
7,000 g = ____ kg
70
700
7
0.07
240 cm = ___________ m
2400
24
2.4
0.24
3 km = ___________ mm
30
300
3,000
3,000,000
68 cm = ___________ mm
0.68
6.8
68
680
32.9 km = ___________ cm
32,900
329,000
3,290,000
32,900,000
Which unit is the smallest?
km
mm
m
cm
The slope of a position-time is equal to __________.
displacement
speed
velocity
acceleration
Select ALL of the scalar measurements
speed
velocity
acceleration
displacement
distance
Select ALL of the vector measurements
time
velocity
mass
acceleration
displacement
Select ALL 3 ways to accelerate:
speed up
slow down
turn
move with at a constant speed
don't move
Free Fall means: (select all that apply)
no air resistance
no acceleration
constant acceleration
constant velocity
Objects sliding or rolling down a ramp move with and increasing __________ and a constant ___________.
velocity, acceleration
acceleration, velocity
time, velocity
mass, acceleration
A ball is rolled down a ramp. After 2 seconds it's velocity is measured to be 6 m/s. What is its acceleration?
1 m/s/s
2 m/s/s
3 m/s/s
6 m/s/s
Which graph shows the object slowing down?
D
E
both D and E
neither D or E

Which words describes the velocity in this graph? (select 2 answers)
positive
negative
decreasing
increasing

Which section of the graph shows increasing velocity?
AB
BC
DE
EF
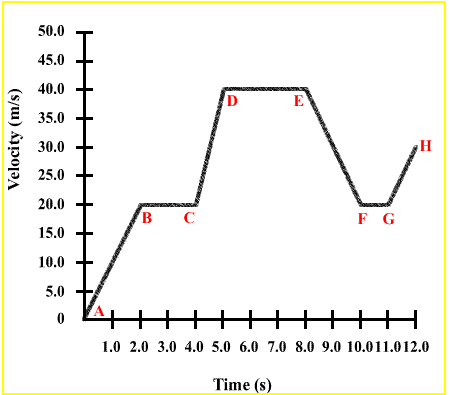
Which sections of the graph shows constant velocity? (select 2 answers)
AB
BC
EF
FG
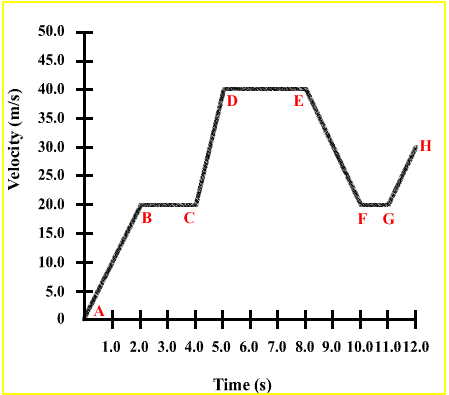
Which section of the graph shows acceleration? (select all that apply)
AB
BC
CD
EF

What is happening in the graph from point O to A?
The object is moving SLOWLY
The object is moving FAST
The object is NOT moving
The object is accelerating
Which word describes the acceleration in this graph?
positive
negative
decreasing
increasing

