wayground logo

Free Printable Worksheets

Font size

S
M
L
XL
Worksheets

Reading distance time graphs

Total questions: 33

Worksheet time: 38mins

Name
Class
Date
1.
How long did it take this object to travel 10 m?
a)
0 s
b)
10 s
c)
15 s
d)
20 s
2.
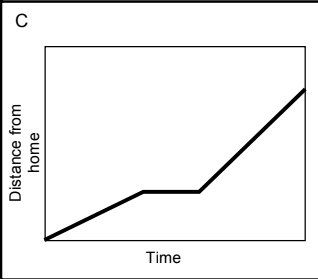
What is happening at C?
a)
Stationary
b)
Accelerating
c)
Fast steady speed; moving away from the starting position
d)
Slower steady speed; moving away from the starting position
3.
What does this graph represent?
a)
Constant speed
b)
Acceleration
c)
Not moving
4.
Which runner won the race?
a)
Albert
b)
Bob
c)
Charlie
5.
Which runner had a head start?
a)
A
b)
B
c)
C
6.
What is the equation to calculate distance?
a)
distance = speed/time
b)
distance = time/speed
c)
distance = speed/distance
d)
distance = speed x time 
7.
What is the speed of a car that travels 400 m in 20 minutes?
a)
20 miles/hr
b)
20 m/min
c)
800 m/min
d)
200 miles/hr
8.
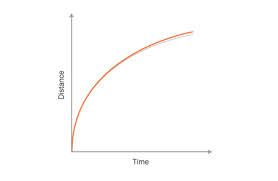
What is this graph showing?
a)
Constant Speed
b)
Acceleration (speeding up)
c)
Deceleration (slowing down)
d)
No motion
9.
How long did it take this object to travel 10 m?
a)
0 s
b)
10 s
c)
15 s
d)
20 s
10.
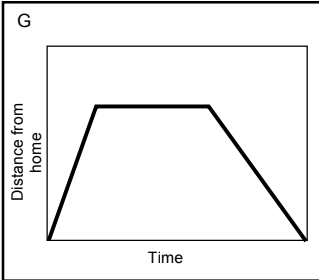
A student runs two times around a running path at a local park.  Each lap is 3 km.  The student completes the first lap in 20 minutes.  The student then sits on a bench and rest for 5 minutes before completing the second lap in 25 minutes.  Which graph bests represents the student's motion?
a)
F
b)
G
c)
H
d)
J
11.

The word "stationary" means...

a)

moving towards

b)

moving away

c)

moving

d)

not moving

12.

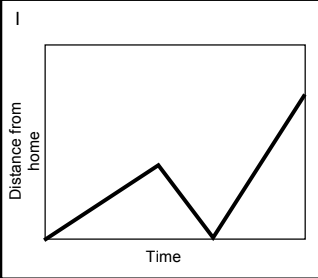
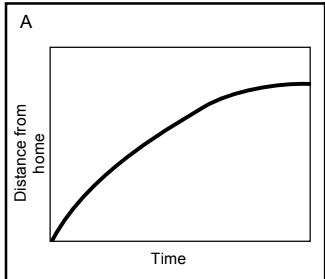
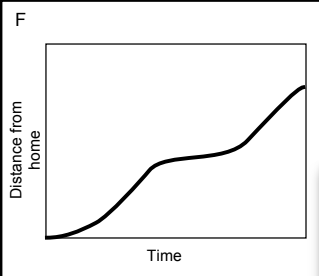
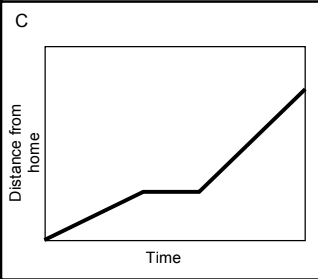
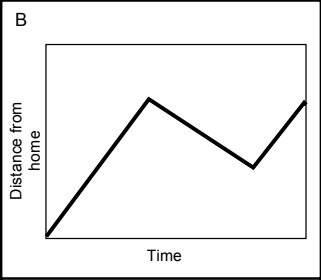
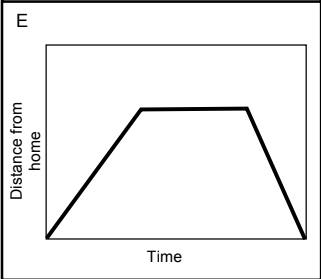
Which graph shows a person returning to the start line?

a)

A

b)

B

c)

C

d)

D

13.

What does this picture tell you about the line?

a)

The person is moving slowly

b)

The person is getting closer to his destination

c)

The person is mobile (Moving)

d)

The person is stationary (Not Moving)

14.
What is the average speed of the ball if it falls 40 meters 20 seconds?
a)
A.  20 m/s
b)
B.  10 m/s
c)
C.  0.5 m/s
d)
D.  2 m/s 
15.
According to the graph how far does the person travel in the first 5 seconds?
a)
2 m
b)
10 m
c)
0 m
d)
5 m
16.
What is the speed of this object at 3 seconds?
a)
5 m/s
b)
45 m/s
c)
5 s/m
d)
45 s/m
17.
Molly is watching a wind-up toy walking across a table. She observes that the toy covers 1 cm every second for 10 seconds. Which graph do you think most closely represents the toy's  journey across the table?
a)
A
b)
B
c)
C
d)
D
18.

If a lizard can run 8 m across the water in 4 seconds, how fast is he traveling?

a)

32 m/s

b)

2 m/s

c)

2 seconds

d)

34 meters

19.

If the man and the ball travels 90 m in 9 seconds, what is their average speed?

a)

10 m/s

b)

180 m/s

c)

99 m/s

d)

10 meters

20.
How long did it take this object to travel 10 m?
a)
0 s
b)
10 s
c)
15 s
d)
20 s
21.
a)
b)
c)
d)
22.
a)
b)
c)
d)
23.
a)
b)
c)
d)
24.
a)
b)
c)
d)
25.
Which runner won the race?
a)
A
b)
B
c)
C
26.
What does this graph represent?
a)
Constant Speed
b)
Acceleration
c)
Not moving
27.
At 60 seconds, how far had this object traveled? 
a)
0 m
b)
10 m
c)
20 m
d)
40 m
28.
What does this graph represent?
a)
Constant speed
b)
Acceleration
c)
Not moving
29.

Which of the following is the correct equation for calculating SPEED?

a)

s = d / t

b)

s = d x t

c)

s = t / d

d)

s = d - t

30.
How many times does this object STOP moving?
a)
None
b)
Once
c)
Twice
d)
Three times
31.
What is this graph showing?
a)
Constant Speed
b)
Acceleration (speeding up)
c)
Deceleration (slowing down)
d)
No motion
32.
What is this graph showing?
a)
Constant Speed
b)
Acceleration (speeding up)
c)
Deceleration (slowing down)
d)
No motion
33.

How would you calculate the time it takes for a bird flying at a speed of 45 km/hr to travel a distance of 1,800 kilometers?

a)

45 ÷ 1,800

b)

45 × 1,800

c)

1,800 ÷ 45

d)

1,800 - 45