wayground logo

Free Printable Worksheets

Font size

S
M
L
XL
Worksheets

Speed, Velocity & Acceleration

Total questions: 48

Worksheet time: 3hrs 7mins

Name
Class
Date
1.
Acceleration: is the rate of change in ___________.
a)
speed
b)
distance
c)
velocity 
d)
displacement 
2.
The SI unit for acceleration is
a)
mph
b)
ft/sec2
c)
m/s2
3.
When are you undergoing an acceleration in a car? 
a)
speed up
b)
slow down
c)
make turns
d)
All of the above 
4.
A golf ball accelerates off a tee at 15m/s2, changing its velocity from 0m/s to 50 m/s down the fairway. How long did it take the golf ball to accelerate?
a)
750 seconds
b)
35 seconds
c)
0.3 seconds
d)
3.3 seconds
5.
You are walking in a straight line at a consistent speed. Do you have acceleration? 
a)
no
b)
yes 
6.

How much time did it take Matthew to slow down to a complete stop, after traveling at 30 m/s. His acceleration is -12 m/s2

a)

2.5 s

b)

360 s

c)

.4 s

d)

-2.5 s

7.

If Anthony was running for 300 s after starting at rest, what was his final velocity if he had an acceleration of 0.05 m/s2

a)

.25 m/s

b)

.01 m/s

c)

100 m/s

d)

15 m/s

8.

Mars’ gravitational force is less than that of Earth’s . If an astronaut drops a hammer and its speed increases from 0 to 15 m/s in 4.04 s, what is the acceleration due to gravity on Mars?

a)

9.8 m/s2

b)

0.269 m/s2

c)

60.6 m/s2

d)

3.71 m/s2

9.
Bill jogs 400 meters to Andy's house, turns around, and runs 400 meters back home.  He does so in 267 seconds.  What is Bill's average speed?
a)
about 3 m/s
b)
about 1.5 m/s
c)
0
d)
about 4 m/s
10.
What is this graph representing?
a)
Constant Speed
b)
Acceleration (speeding up)
c)
Deceleration (slowing down)
d)
No motion
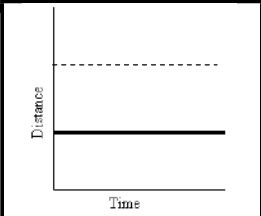
11.
In which of the following graphs (click the image) are both runners moving at the same speed (note that graph c is the bottom right graph, and graph d is the bottom left graph)? 
a)
Graph A
b)
Graph B
c)
Graph C
d)
Graph D
12.
What two measurements are necessary for calculating speed?
a)
Mass and time
b)
Temperature and mass
c)
Mass and distance
d)
Distance and time
13.
At 60 seconds, how far had this object traveled? 
a)
0 m
b)
10 m
c)
20 m
d)
40 m
14.
How long did it take this object to travel 10 m?
a)
0 s
b)
10 s
c)
15 s
d)
20 s
15.
What is happening in this graph from point B to C?
a)
The object is going down a hill.
b)
The object is returning to its starting location.
c)
The object is slowing down.
d)
The object is staying still.
16.
What is happening in this graph from point A to B?
a)
The object is accelerating.
b)
The object is not moving.
c)
The object is decelerating.
d)
The object is moving at a constant speed.
17.
If you run around the football field (which is 2 miles) 3 times, what is your distance?
a)
0 miles
b)
3 miles
c)
6 miles
d)
9 miles
18.
What does this graph represent?
a)
Constant speed
b)
Acceleration
c)
Not moving
19.
What is the speed of an object that travels 60 meters in 4 seconds?
a)
240 m/s
b)
15 m/s
c)
0.067 m/s
d)
15 mph
20.
A measurement of how fast an object is moving
a)
Velocity
b)
Speed
c)
Vector
d)
Acceleration
21.
A description of the speed and direction of an object's motion
a)
Velocity
b)
Speed
c)
Acceleration
d)
Vector
22.
Can be measured in seconds (s)
a)
Distance
b)
Time
c)
Speed
d)
Acceleration
23.
What is the speed of an object that travels 20 meters in 4 seconds?
a)
80 m/s
b)
0.2 m/s
c)
5 m/s
d)
24 m/s
24.
What is velocity?
a)
the quickness of an object
b)
the location of an object
c)
acceleration
d)
speed in a specific direction
25.
A golf ball accelerates off a tee at 15m/s2, changing its velocity from 0m/s to 50 m/s down the fairway. How long did it take the golf ball to accelerate?
a)
750 seconds
b)
35 seconds
c)
0.3 seconds
d)
3.3 seconds
26.
A box sliding down an inclined plane attains a velocity of 27 m/s in 3 seconds from rest.  Find the acceleration.
a)
30 m/s
b)
24 m/s2
c)
9 m/s2
d)
81 km/hr
27.
How fast is the car traveling at 30 seconds?
a)
5m/s
b)
10m/s
c)
20m/s
d)
30m/s
28.
The picture of the position vs. time graph shows an object that is...
a)
accelerating/speeding up
b)
moving at a constant speed 
c)
not moving 
d)
accelerating/slowing down. 
29.
Acceleration is defined as the CHANGE in 
a)
time it takes for one place to move to another place. 
b)
velocity of an object.
c)
distance divided by the time interval 
d)
velocity divided by the time interval 
30.
Why does a car accelerate as it round a corner at a constant speed?
a)
Its direction changes
b)
It doesn't
c)
It slows down
d)
Its speeds up  
31.
Acceleration only takes place when things speed up. 
a)
True
b)
False
32.
In each of the following cases, determine where the car has no acceleration ?
a)
A car shortly after a stoplight turns green.
b)
A car approaching a red light
c)
A car with the cruise control set at 80 km/h
d)
A car turning a curve at a constant speed
33.
Determine the motion of the car.
a)
at rest 
b)
moving at constant speed
c)
speeding up
d)
slowing down
34.
Determine the motion of the car.
a)
at rest 
b)
constant velocity 
c)
speeding up
d)
slowing down
35.
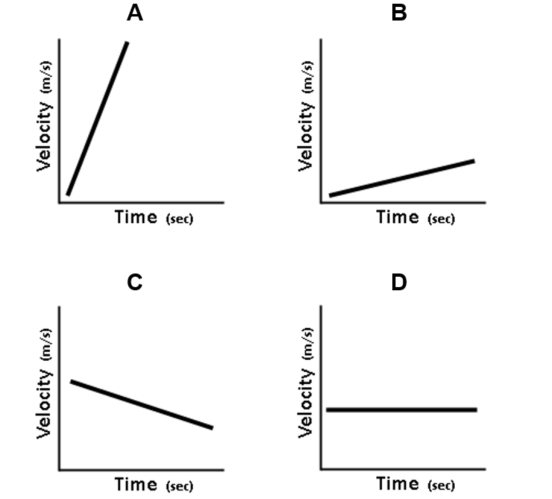
Which graph shows the object standing still?
a)
A
b)
B
c)
C
d)
D
36.
Which graph represents zero acceleration (constant velocity)?
a)
A
b)
B
c)
C
d)
D
37.
Which graph demonstrates the greatest positive speed?
a)
A
b)
B
c)
C
d)
D
38.
Which graph represents the greatest acceleration?
a)
A
b)
B
c)
C
d)
D
39.
Which dot graph shows something speeding up?
a)
.......  .   .    .     .            .              
b)
.       .     .    .  . .........
c)
..................................
d)
.   .   .   .   .   .   .   .
40.

Which time interval shows a constant velocity and no acceleration?

a)

18 s to 24 s

b)

4 s to 18 s

c)

0 s to 24 s

d)

0 s to 3 s

41.

Which dot graph shows something slowing down?

a)
.......  .   .    .     .            .              
b)
.       .     .    .  . .........
c)
..................................
d)
.   .   .   .   .   .   .   .
42.

Which dot graph shows something moving at a constant slow pace?

a)
.......  .   .    .     .            .              
b)
.       .     .    .  . .........
c)
..................................
d)
.   .   .   .   .   .   .   .
43.

Which dot graph shows something moving at a constant fast pace?

a)
.......  .   .    .     .            .              
b)
.       .     .    .  . .........
c)
..................................
d)
.   .   .   .   .   .   .   .
44.

Consider the car in the above image. If the car exited the road and headed toward Dick’s Sporting Goods at a constant speed of 61 mph,

a)

there would be a change in velocity ONLY.

b)

there would be a change in acceleration ONLY.

c)

neither velocity nor acceleration would change.

d)

there would be a change in both velocity and acceleration.

45.

Velocity is ​ (a)   in a given ​ (b)  

Choose from the below words
Speed
Direction.
46.

Two runners are running around a track in different directions. The runners have the same ​ (a)   but they do not have the same ​ (b)   .

Choose from the below words
speed
velocity
47.

The image shows the velocity vectors(arrows) of 2 cars. The blue vector being longer tells us that car has a greater...

a)

Time

b)

Distance

c)

Speed

48.

What is acceleration?

a)
the quickness of an object
b)

the rate at which speed changes

c)

constant velocity in a specific direction.

d)

a change in velocity for an object