
 Worksheets
SEM 1 Review 2021
Total questions: 86
Worksheet time: 3hrs 0mins


What is the length of the object in centimeters?
3.40 cm
4.3 cm
3.5 cm
1 1/4 inches

What is the volume of the liquid in this graduated cylinder?
19 mL
35 mL
24.0 mL
26.0 mL

Which answer best approximates the metric temperature reading on the thermometer?
82.9 F
86 C
30 C
30.0 C

Read the graduated cylinder to the appropriate precision. Which answer is most appropriate?
6.3 mL
6 mL
6.61mL
6.31 mL

Which is the correct temperature for this thermometer?
58.4 oC
57.4 oC
50.74 oC
57 oC

What is the length of the pencil?
2.5cm
3cm
2.56cm
3.0cm

3cm
4cm
3.6cm
3.60cm
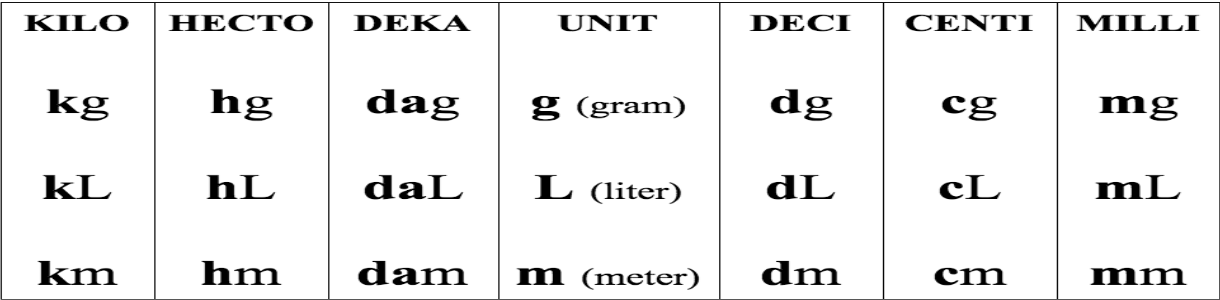
0.0079 cm = mm
0.079
0.79
7.9
0.0079
0.00079
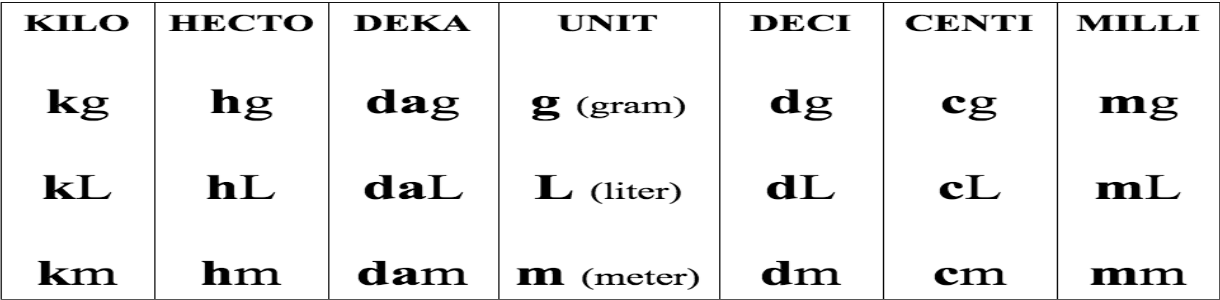
0.00738 L = ___ mL
7.38
73.8
0.738
0.0738
738
What is 0.9km in meters?
0.9
9
90
900
what is 6250mg in g?
6.25
62.5
625
0.625


Jermaine runs exactly 2 laps around a 400 meter track. What is his displacement for his whole run?
800 meters
400 meters
0 meters
200 meters

The graph represents (Consider Distance on the y axis the same as position)
No motion
Constant velocity
Acceleration
Deceleration

The graph represents (consider distance like position)
Acceleration
No motion
Deceleration
Constant Velocity
Acceleration of an object happens when things ________
slow down
go faster
change direction (turn)
All of the above


Velocity definition
Total distance divided by time squared: The rate of change in time
Displacement divided by time: The rate of change in position.
Change in position with a direction
Change in velocity divided by time

Consider the position vs. time graph below for cyclists A and B.
Do the cyclists start at the same point?
Yes
No

What is happening at the intersection of lines A and B?
The cyclists stop
The cyclists speeds are equal
The cyclists are at the same position at the same time.

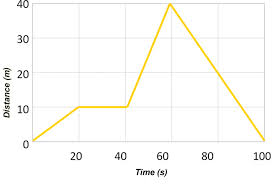
Describe the motion of the object in the graph (this is like a pxt graph
constant velocity
speeding up
slowing down
at rest


What is the object doing from point B to C?
moving forward
not moving
moving backward

According to this graph, what is happening to the velocity?
The object is moving positve the entire time but is moving at different constant velocities
The object is moving positive, then negative at constant velocities
The object is moving backward the entire time at a constant velocity
The object is not moving at all because the line is not increasing or decreasing as time moves forward

According to the graph, what is happening?
The object is moving forward at a constant velocity, then moves backward at a constant velocity.
The object is moving backward at a constant velocity, then forward at a constant velocity
The object is moving forward the entire time at a constant velocity
The object is not moving at all because the line is not increasing
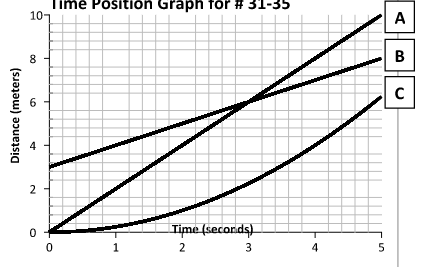


From time 4-5s, who was running faster, Runner B or Runner C?
B
C
They are running at the same speed

What is occurring on this graph?
slowing down in the positive direction
moving at a constant speed in the positive direction
positive change in momentum
positive net force
The velocity-time graphs represent the motion of four different objects. Identify any object that is moving in the + direction and speeding up. Tap on all that apply.


Crystal recorded the distance and time she and Lisa drove their race cars. Which best describes the difference in the motion of the two race cars?
Crystal’s race car is decreasing speed, and Lisa’s race car is
increasing speed.
Crystal’s race car is increasing speed, and Lisa’s race car is
decreasing speed.
Crystal’s race car has not moved, and Lisa’s race car is moving
forward.
Crystal's race care is moving at a constant speed, and Lisa's race car is standing still.


From time 0-1s, who was running faster, Runner B or Runner C?
B
C
They are running at the same speed

On this position vs time graph, what is the velocity?
40 m/s
8 m/s
5 m/s
0 m/s

Which elevator is traveling the FASTEST?
A
B
C
D
E

Displacement is the difference between your
reference point and reference direction
total distance traveled
starting position and your final position
average speed

Which of the following position time graphs matches the velocity time graph?


Which of the following velocity time graphs matches this position time graph?


which of the following velocity time graphs matches this position time graph?


what is the formula for acceleration?
a=ΔtΔv
a=td
Slope of a position by time graph

Find the acceleration from A to B.
0.5 s2m
0.5 m/s
2 s2m

what is happening in this velocity time graph from C to D?
uniform positive velocity
body is at rest
constant velocity

Calculate the acceleration of the object represented in the graph.
5/2m/s2
40m/s
2m/s2
Calculate the acceleration of the object represented in the graph.
5/2m/s2
40m/s
2m/s2
Correlation or Causation?
The speed you drive and the amount of fuel you use
Correlation
Causation
Correlation or Causation?
The inches of snowfall and the number of heart attacks
Correlation
Causation
Correlation or Causation?
Number of followers on social media and number of posts
Correlation
Causation
Correlation or Causation?
When it rains several inches, the water level of a lake increases
Correlation
Causation
Correlation or Causation?
When there is more protein in an athlete's diet, the athlete scores more points in a game
Correlation
Causation
Which example shows CAUSATION?
Taller people have larger shoe sizes and shorter people have smaller shoe sizes.
If you exercise, the calories burned per minute increases.
Which one of these examples is NOT an example of CAUSATION?
Kryptonite causes Superman to lose all his powers.
Temperatures of less than 32˚F cause water to freeze.
Umbrellas cause rainstorms.
Stepping on the gas pedal causes a car to move faster.


Is this line an accurate line estimate of best fit for the data?
Yes
No

