
 Worksheets
Line Graphs
Total questions: 15
Worksheet time: 1hrs 15mins
Name
Class
Date
1.

When was the greatest amount of shoppers at the store?
a)
10am
b)
1pm
c)
6pm
d)
2pm
2.

How many push-ups were done on Monday?
a)
5
b)
10
c)
15
d)
20
3.

Between which two days was the greatest decrease in push-ups?
a)
Friday and Saturday
b)
Tuesday and Wednesday
c)
Sunday and Monday
d)
Thursday and Friday
4.

What was the bear population in 2001?
a)
40
b)
45
c)
50
d)
55
5.

Between which two years did the bear population remain constant or the same?
a)
2004 and 2005
b)
2001 and 2002
c)
2005 and 2006
d)
2000 and 2001
6.
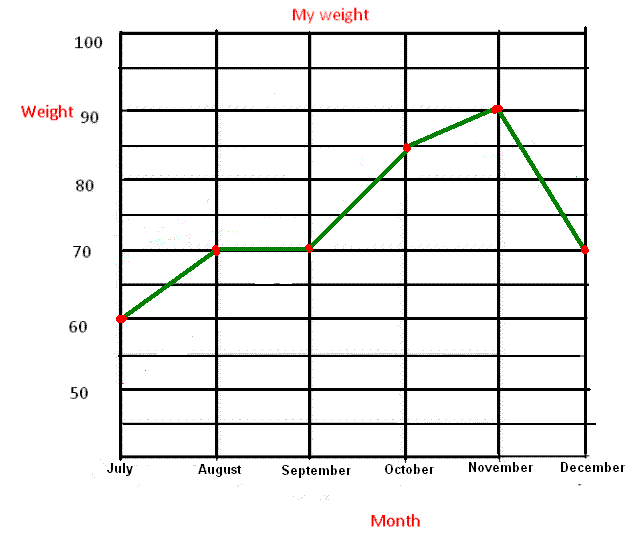
In which month was my weight the highest?
a)
July
b)
September
c)
November
d)
December
7.

Did the temperature increase or decrease between day 1 and day 2?
a)
increase
b)
decrease
8.
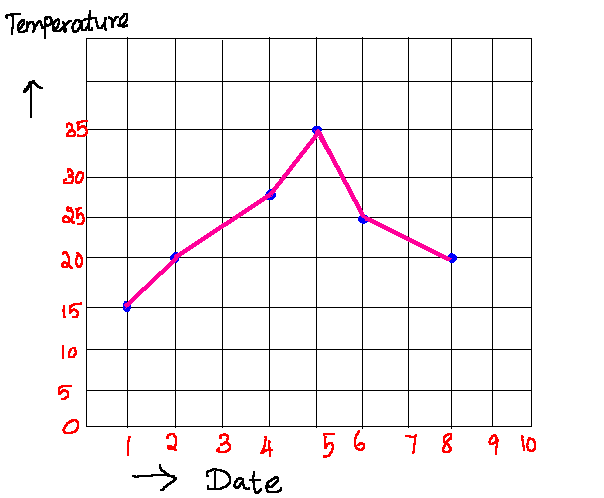
On which 2 days was the temperature the same?
a)
2 and 8
b)
1 and 6
c)
3 and 4
d)
5 and 8
9.
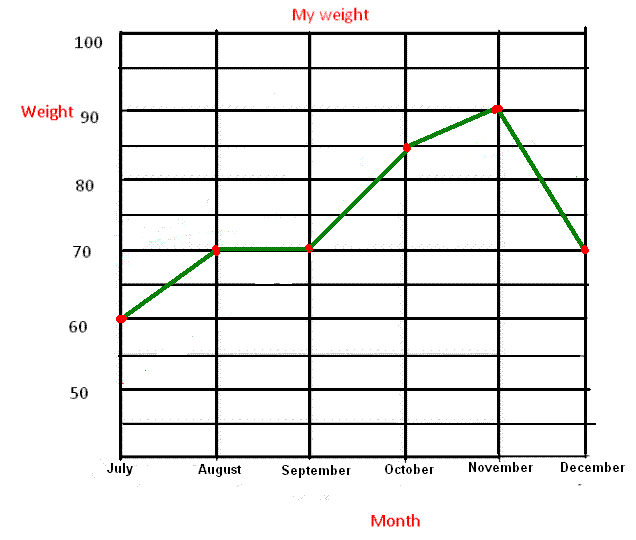
What was the overall trend on this graph?
a)
decreasing
b)
increasing
10.

How much does it cost to have your lawn mowed for 2 hours?
a)
$16
b)
$17
c)
$18
d)
$19
11.

What is the general trend of this line graph?
a)
The more you mow, the less money you make.
b)
You make the same amount of money regardless of how long you mow.
c)
The more you mow, the more money you make.
d)
Mowing is dangerous.
12.

Annie recorded the amount of rain that fell each day. The results are shown in the line graph below. How many centimeters of rain fell on the third day?
a)
2
b)
3
c)
4
d)
7
13.

The graph shows the number of inches a plant grew each week.
Between which 2 weeks did the plant grow the MOST?
a)
Week 1 and Week 2
b)
Week 2 and Week 3
c)
Week 3 and Week 4
d)
Week 4 and Week 5
14.
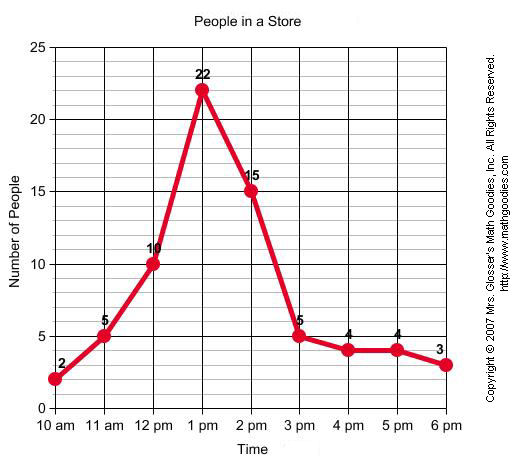
Between which two times was the greatest increase in number of shoppers?
a)
12pm and 1pm
b)
1pm and 2pm
c)
2pm and 3pm
d)
10am and 11am
15.
What kind of graph shows change over time?
a)
bar graph
b)
line graph
c)
line plot
d)
pie graph
100 %

