
 Worksheets
MOTION IN A STRAIGHT LINE
Total questions: 19
Worksheet time: 13mins
Name
Class
Date
1.
A distance vs. time graph shows an object's
a)
frame of reference
b)
speed
c)
acceleration
d)
favorite food
2.
All motion is described as relative because
a)
how do you ever really know if something is in motion
b)
motion means different things to different people
c)
everything in the universe is constantly in motion, so it depends on your frame of reference
3.
Kinematic equations links all of these things together
a)
time, space, and speed
b)
motion, acceleration, and force
c)
time, position, velocity, and acceleration
d)
force, acceleration, rate, and Roxann
4.
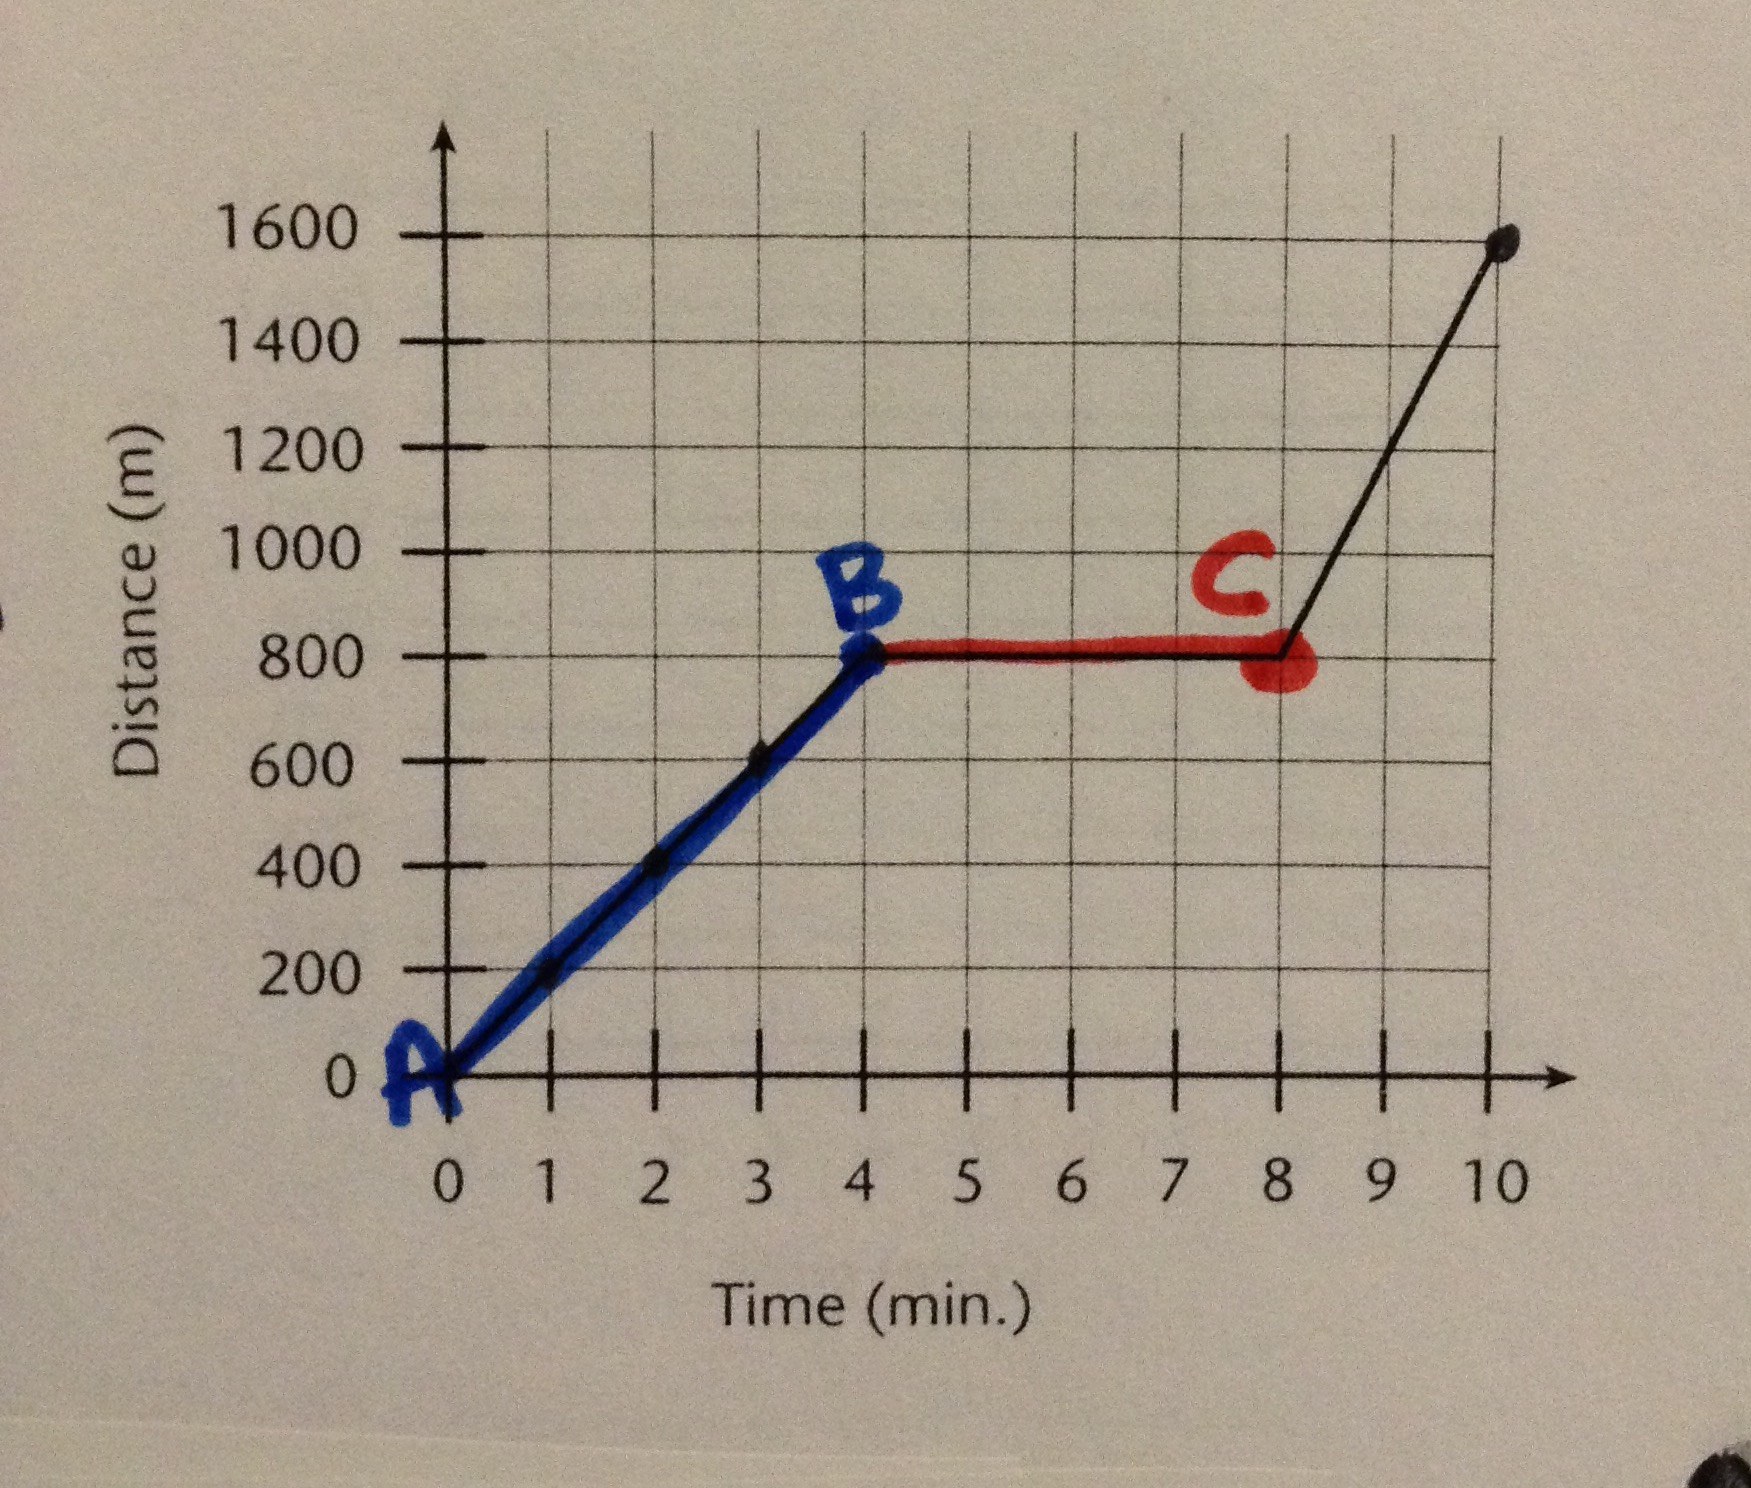
The graph shows Ashley riding her bike to Maria's house.
What is occurring from point A to point B?
What is occurring from point A to point B?
a)
they are traveling at a constant speed
b)
they are decreasing in speed
c)
they stopped to take a break
5.
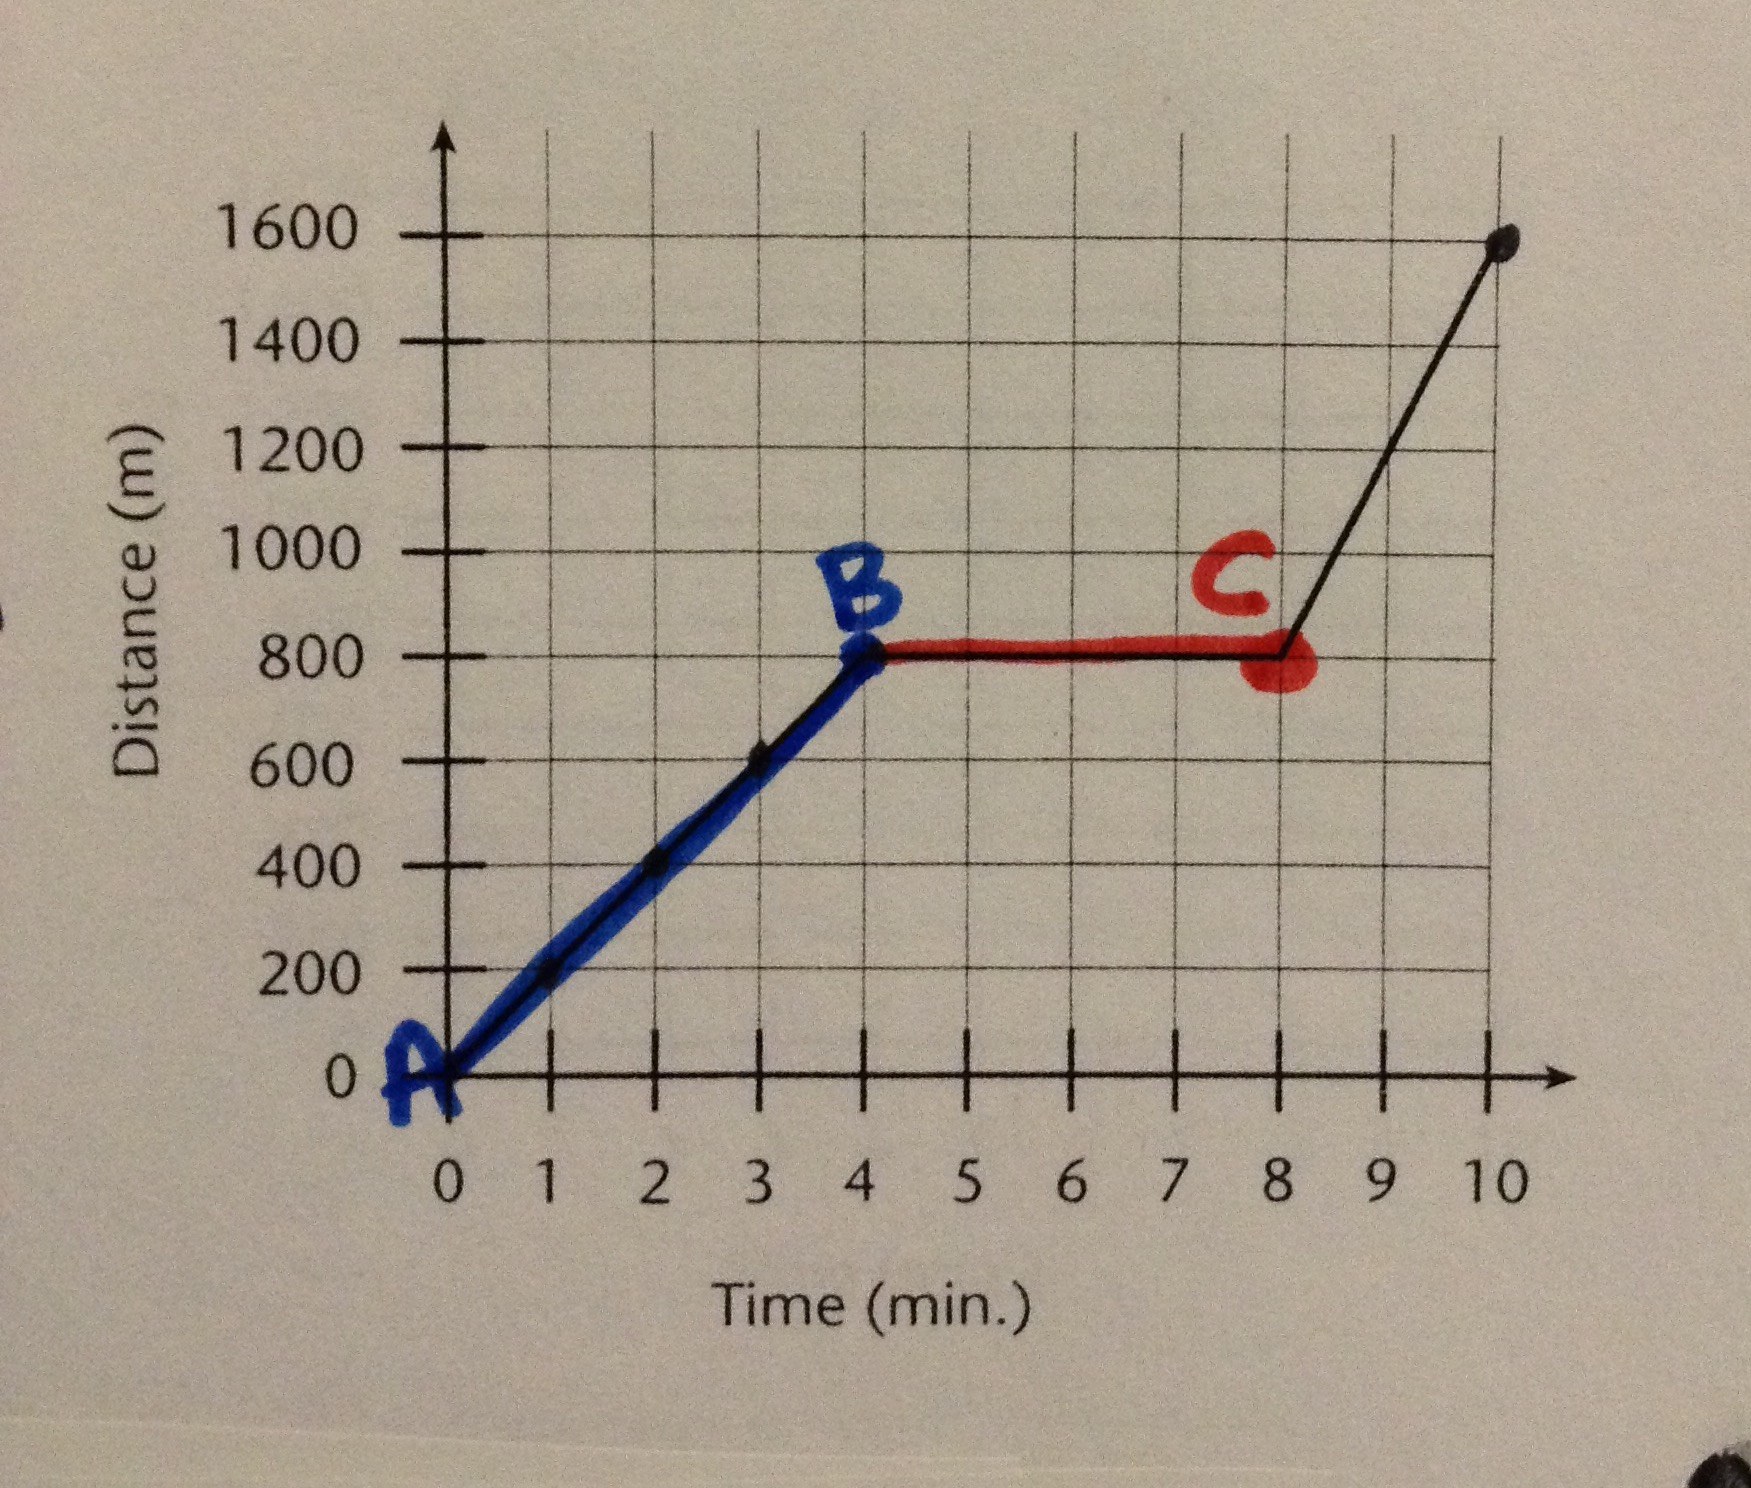
The graph shows Ashley riding her bike to Maria's house.
What was occurring from point B to point C?
What was occurring from point B to point C?
a)
She was increasing her speed.
b)
She stopped for 4 minutes
c)
She was decreasing in speed
6.
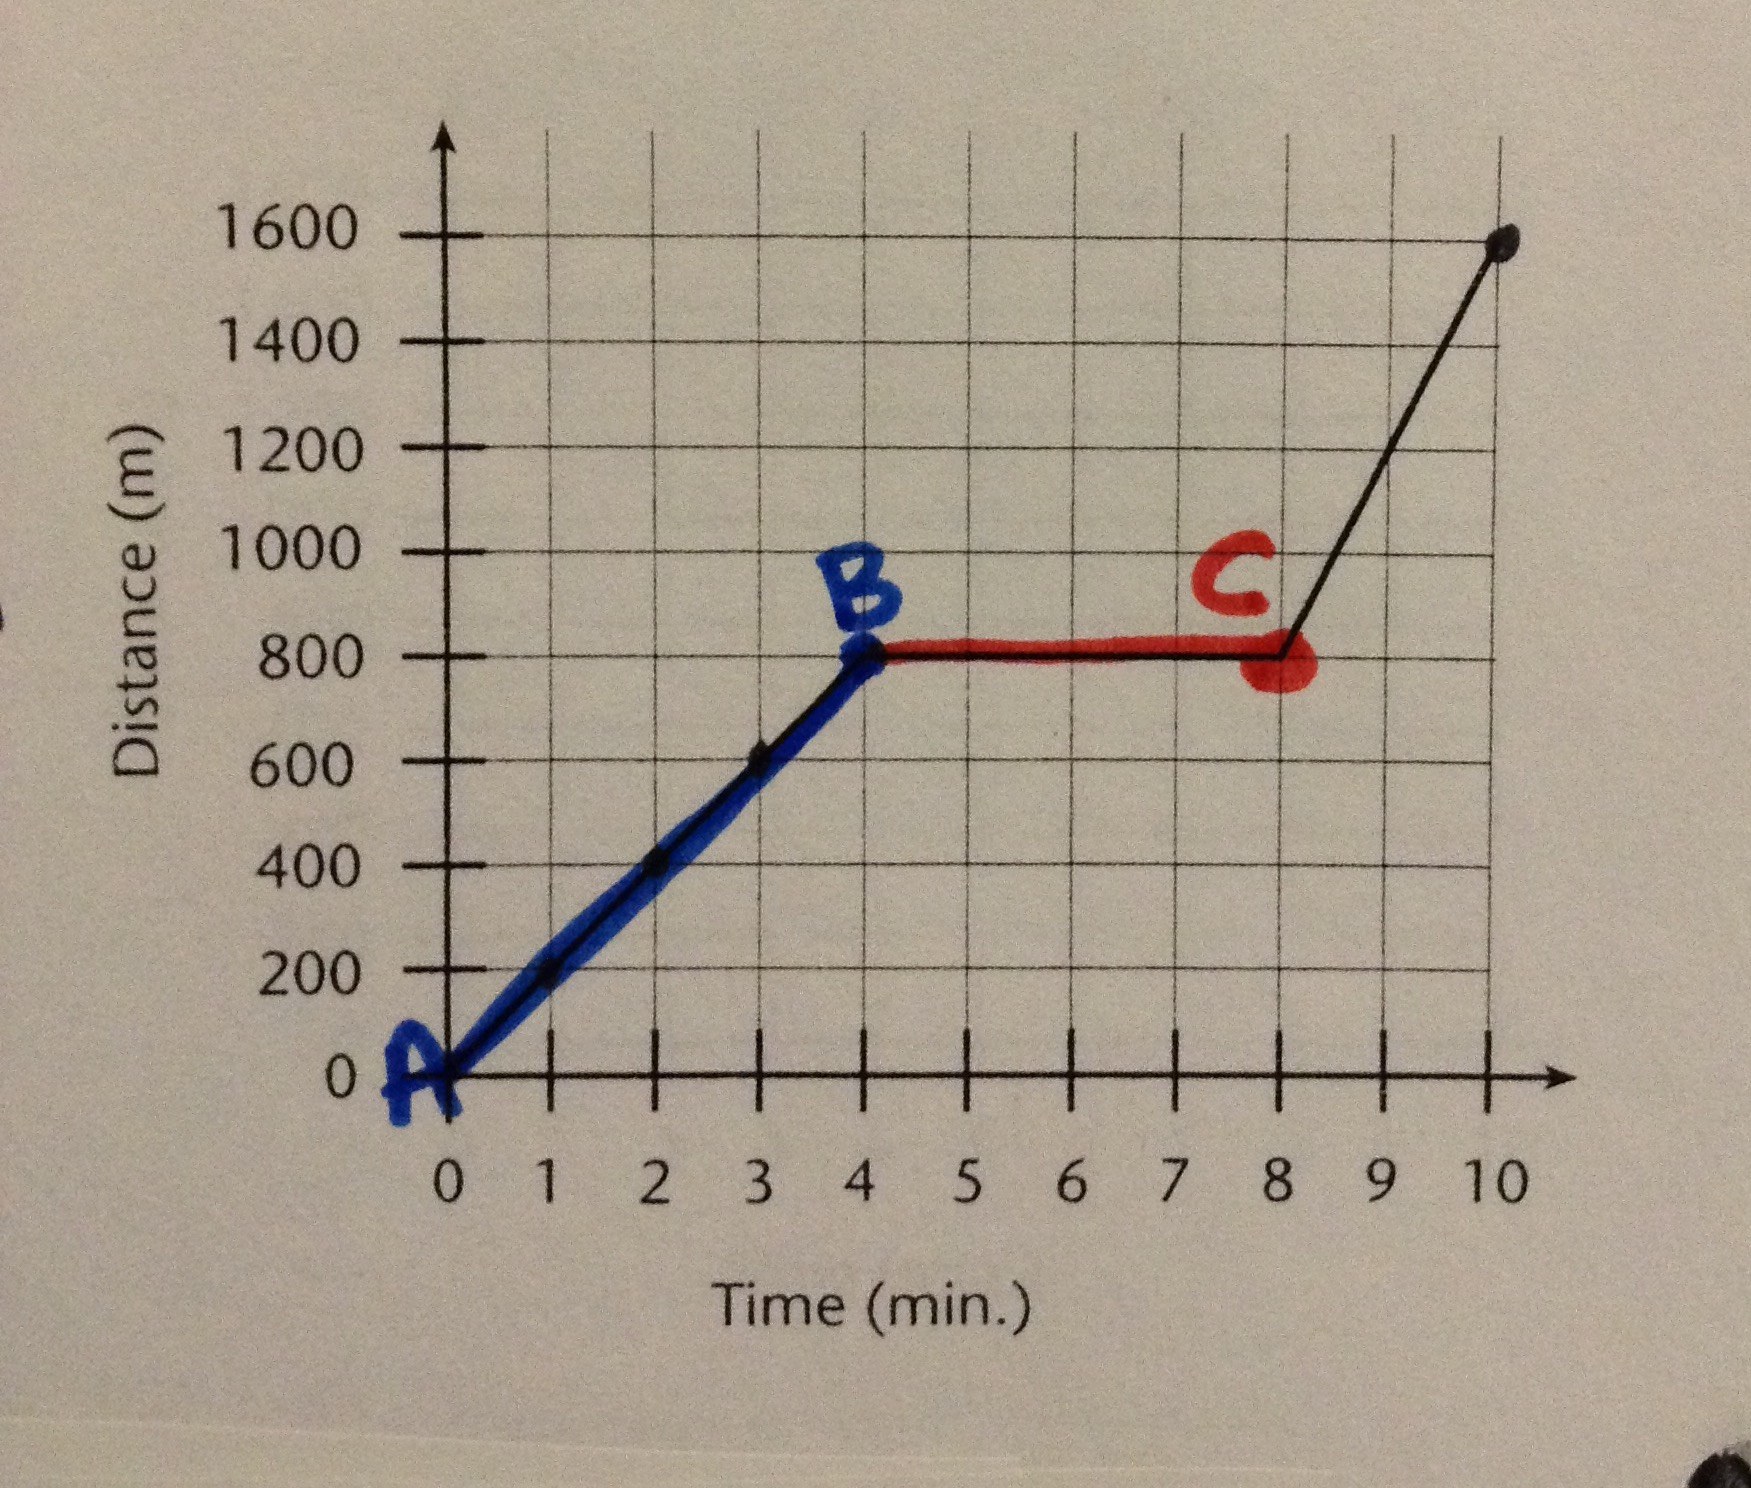
The graph shows Ashley riding her bike to Maria's house.
What was her average speed for the ENTIRE trip?
What was her average speed for the ENTIRE trip?
a)
1600 m/min
b)
200 m/min
c)
160 m/min
7.

Which runner won the race?
a)
A
b)
B
c)
C
8.
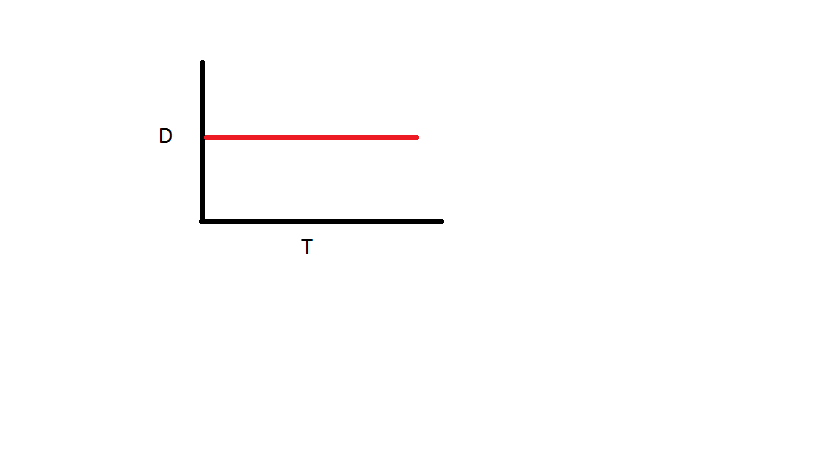
The graph represents
a)
No motion
b)
Constant velocity
c)
Acceleration
d)
Deceleration
9.

A student draws a straight blue line on a position-time graph to represent the general shape of the position-time data for a toy.
What is this straight blue line called?
What is this straight blue line called?
a)
Distance line
b)
Slope line
c)
Uniform line
d)
Best-fit line
10.

Which graph represents the greatest acceleration?
a)
A
b)
B
c)
C
d)
D
11.

Which graph represents zero acceleration (constant velocity)?
a)
A
b)
B
c)
C
d)
D
12.
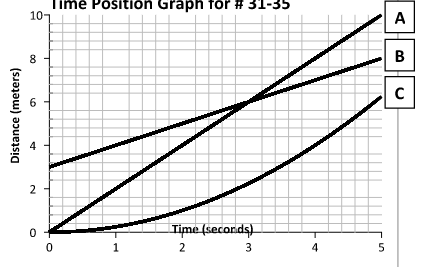
Which runner had a head start?
a)
A
b)
B
c)
C
13.
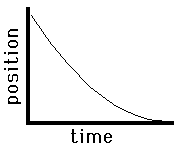
Describe the motion
a)
Slow to fast; Negative direction
b)
Fast to slow; Negative direction
c)
Fast to slow; Positive direction
d)
Slow to fast; Positive direction
14.

In which of the following graphs (click the image) are both runners moving at the same speed (note that graph c is the bottom right graph, and graph d is the bottom left graph)?
a)
Graph A
b)
Graph B
c)
Graph C
d)
Graph D
15.
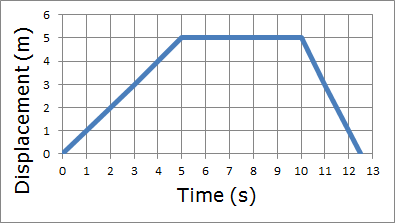
According to the graph how far does the person travel in the first 5 seconds?
a)
2 m
b)
10 m
c)
0 m
d)
5 m
16.

How far is the person from the starting point after 3 seconds?
a)
0 m
b)
2 m
c)
3 m
d)
6 m
17.
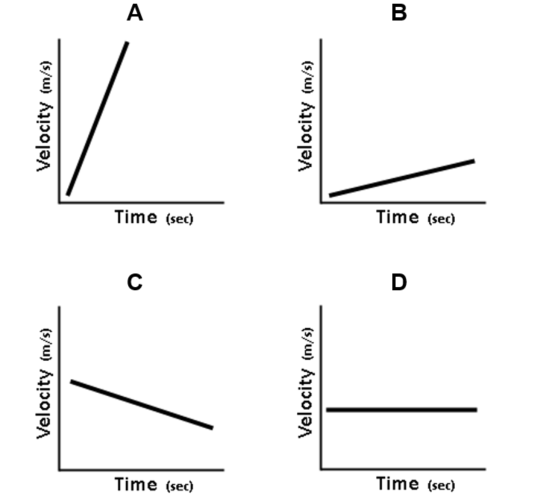
Which graph represents zero acceleration (constant velocity)?
a)
A
b)
B
c)
C
d)
D
18.
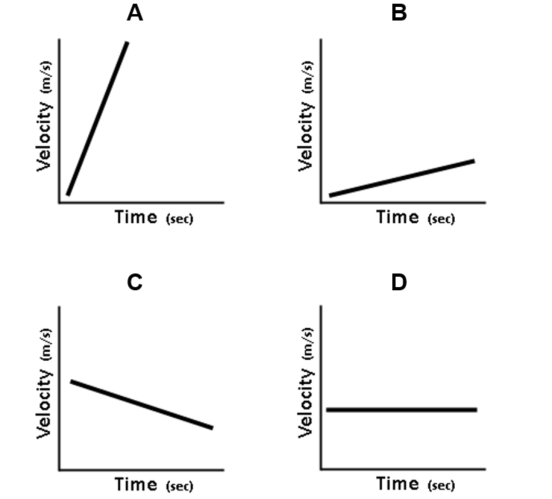
Which graph represents the greatest acceleration?
a)
A
b)
B
c)
C
d)
D
19.

According to this velocity graph, velocity is negative and acceleration is ___________. So speed is ___________
a)
positive, increasing
b)
negative, increasing
c)
negative, decreasing
d)
positive, decreasing
100 %

