wayground logo

Free Printable Worksheets

Font size

S
M
L
XL
Worksheets

SEP Review Quiz

Total questions: 38

Worksheet time: 1hrs 14mins

Name
Class
Date
1.
What is the first step in the Engineering  Design process?
a)
Follow the Plan
b)
Brainstorm Ideas
c)
Identify the problem
d)
Discuss what can work better
2.
What is the second step in the Engineering  Design process?
a)
Draw a diagram
b)
Brainstorm ideas
c)
Identify the constraints
d)
Test it Out!
3.
What is the third step in the Engineering Design process?
a)
Test it out
b)
Follow the plan
c)
Choose the best idea
d)
Make a plan
4.
What is the fourth step in the Engineering Design Process?
a)
Create: follow the plan and test it
b)
Discuss what can work better
c)
Make a plan and draw a diagram
d)
Identify the problem
5.
What's the fifth step in the Engineering Design process?
a)
Identify your constraints
b)
Discuss what can work better and improve your design
c)
Gather your needed materials
d)
Follow the plan and test it out
6.
Engineers test and retest their designs to?
a)
spend money
b)
improve constraints
c)
improve designs
d)
build more models
7.

What is the manipulated variable?

a)

what we are changing or testing

b)

what we are observing or measuring

c)

what we keep the same to make the experiment fair

8.

What are the constant variables?

a)

what we are changing or testing

b)

what we are observing or measuring

c)

what we keep the same to make the experiment fair

9.

This variable is the one thing that changed on purpose...

a)

Dependent Variable

b)

Control

c)

Independent Variable

10.

What is the DEPENDENT variable (effect) in this experiment?


"Does eating breakfast improve test scores?"

a)

eating breakfast or not

b)

the grade you got on the test

c)

what time you get up in the morning

d)

how tasty the breakfast is

11.

You are testing how the amount you water a plant affects its growth. What would be the INDEPENDENT VARIABLE in this experiment.

a)

They type of pot you put the plants in.

b)

The amount you water each plant.

c)

The amount of sunlight the plants get.

d)

The amount the plant grows.

12.

A scientist is testing which flavor of ice cream melts the fastest. What would his controlled variables be? (choose ALL that apply)

a)

The flavor of ice cream

b)

the kind of cone the ice creams are in

c)

the place in the room where the ice cream is

d)

the size of the scoop

e)

the time it takes to melt

13.

The variable that is being tested, counted, or measured and how it reacts to the independent variable is known as:

a)

Independent Variable

b)

Controlled Variable

c)

Dependent Variable

14.

What is the DEPENDENT variable (effect that is measured) in this experiment?

"Do tall people jump further than short people?"

a)

height of the person

b)

weight of the person

c)

how fast the person runs

d)

how far the person jumps

15.

These are the variables that should stay the same. They do not get any changes in order to make for a fair test.

a)

Dependent Variables

b)

Controlled variables

c)

Independent Variables

16.

Mr. Pransky wants to see how different surfaces affect how high a tennis ball can bounce. What is the independent variable?

a)

the different surfaces

b)

using the same ball

c)

how high they bounce

17.

How many independent variables are allowed to be changed in an experiment?

a)

1

b)

2

c)

as many as you want

d)

0

18.

How many students take the bus to school?

a)

35

b)

20

c)

10

d)

15

19.

Which circle graph has the same data as the bar graph?

a)
b)
c)
d)
20.

Which bar graph is the same as the data in the circle graph if 20 people were surveyed?

a)
b)
c)
d)
21.

The bar graph shows pizza toppings students enjoy. Which circle graph displays the same data?

a)
b)
c)
d)
22.
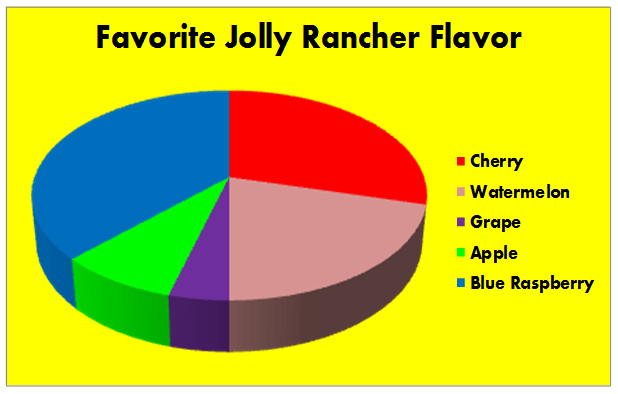
According to this graph, what is the most popular flavor of Jolly Rancher?
a)
Cherry
b)
Grape 
c)
Blue Rasberry
d)
Watermelon
23.
What axis is shown in red?
a)
W-axis
b)
X-Axis
c)
Y-Axis
d)
Z-Axis
24.

The Independent Variable is represented on which Axis?

a)

A

b)

X

c)

B

d)

Y

25.

What do we put at the top of a graph?

a)

X axis

b)

data table

c)

title

d)

nothing

26.

What is the name of the vertical (up and down) axis of the graph?

a)

X axis

b)

Y axis

27.
What is the name of the horizontal (side to side) axis of the graph? 
a)
X axis
b)
Y axis
28.
The Dependent Variable is represented on which Axis?
a)
A
b)
X
c)
B
d)
Y
29.
What is the independent variable in an experiment?
a)
the thing we change or test
b)
the normal situation
c)
what we measure in the end
d)
the thing we keep the same
30.
What is the dependent variable in an experiment? 
a)
the thing we change or test
b)
the thing we keep the same
c)
the thing we measure in the end
d)
the normal situation
31.
What is the Responding (Dependent) Variable in this graph?
a)
Plant Growth
b)
Growth (cm)
c)
Hours
d)
15
32.
A line graph chart allows you to easily see
a)
information about the parts related to the whole.
b)
the total number of each category.
c)
how much data occurs within a range of numbers.
d)
Changes or trends over time.
33.
A bar graph  allows you to easily see
a)
information about the parts related to the whole.
b)
the total number of each category.
c)
comparisons at different times
d)
Changes or trends over time.
34.
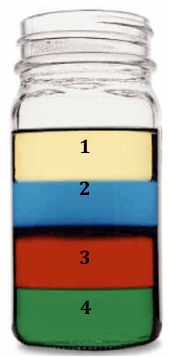
Put the liquids in order from most dense to least dense?
a)
4, 3, 2, 1
b)
1, 2, 3, 4
c)
3, 4, 2, 1, 
d)
4, 3, 1, 2
35.
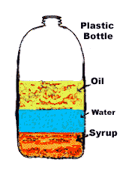
Which liquid is the least dense?
a)
oil
b)
water
c)
syrup 
d)
plastic bottle
36.
Why do objects sink or float in H2O
a)
Because their densities are higher or lower than compared to water
b)
Because their densities are using gravity to pull down
c)
Because their densities are heavier or lighter
d)
Because their mass and volumes are equal 
37.

A bobber floats on the water because it is....

a)

more dense than the water

b)

less dense than the water

c)

the same density as the water

d)

to show you when you have a bite

38.
A brick sinks in water while a wooden block of the same size floats.  This is because the brick has a
a)
lower volume than the wooden block
b)
lower density than the wooden block
c)
higher volume than the wooden block
d)
higher density than the wooden block