wayground logo

Free Printable Worksheets

Font size

S
M
L
XL
Worksheets

math 7/8 probability and data review

Total questions: 35

Worksheet time: 2hrs 9mins

Name
Class
Date
1.

You spin the spinner and flip a coin. Find the probability of the compound event. Spinning an odd number and flipping heads

a)

3/10

b)

2/10

c)

1/5

d)

3/5

2.

You randomly choose one of the tiles.


Without replacing the first tile, you choose a second tile. Find the probability of the compound event. Choosing a 6 and then a prime number.

a)

5/42

b)

4/49

c)

2/21

d)

4/49

3.
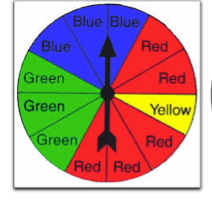
What is the probability of spinning green?
a)
0
b)
1/4
c)
1/2
d)
3/4
4.
P(not A) = 
*Remember to simplify.*
a)
6/8
b)
3/4
c)
2/8
d)
1/4
5.
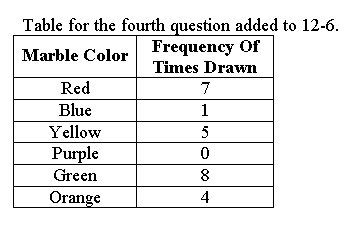
Based on the chart, what is the experimental probability of pulling a green marble?
a)
1/8
b)
8/25
c)
8/100
d)
7/8
6.
Probability can be written as ...
a)
a fraction
b)
a decimal
c)
a percent
d)
all of the above
7.

A farm has 5 brown cows and 10 white cows. A fence is open and two cows escape. What is the probability that it will be a brown cow, then a white cow?

a)

1/9

b)

2/9

c)

5/21

d)

10/21

8.

Kate spun the spinner 75 times and landed on "3" thirty times.

What is the experimental probability as a percentage?

a)

20%

b)

30%

c)

40%

d)

50%

9.

A piggy bank contains 4 quarters, 18 dimes, 10 nickels, and 8 pennies. A coin is chosen at random, not replaced, then another is chosen. Find each probability.


P (penny, then dime).

a)

1/8

b)

9/100

c)

6/65

d)

17/195

10.

Find the probability of each set of independent events.


drawing a black checker from a bag of 6 black checkers and 4 red checkers, replacing it, and drawing another black checker.

a)

2/3

b)

9/25

c)

2/5

d)

3/5

11.

A standard die is rolled twice. Find each probability.


P (odd both times)

a)

1/2

b)

1/4

c)

2/3

d)

1/9

12.

A box contains 5 purple marbles, 3 green marbles and 2 orange marbles. Draws are made with replacement.P(both marbles are purple)

a)

2/9

b)

1/3

c)

1/2

d)

1/4

13.
Pablo chooses a colored marble from a mixed bag and writes down the color. Pablo leaves it out and then draws another.
a)
Independent
b)
Dependent
14.
Andrew picks one marble at a time from a box and replaces it. He repeats this process 25 times and records the results in the table. Based on the table, which color marble has an experimental probability of 1/5?
a)
Yellow
b)
Red
c)
Blue
d)
Green
15.
A set of all possible outcomes is known as - 
a)
a list
b)
a complement
c)
a sample space
d)
an event
16.
Draw a tree diagram in your math workbook.  Then answer this question. A girls' choir is choosing a uniform for their concert. They can pick red, green, or purple sweaters, and they can pick tan, white, or black skirts. The shoes they need come in gold and black. Assuming all the colors go together, how many different combinations can the choir pick?
a)
3 combinations
b)
8 combinations
c)
12 combinations
d)
18 combinations
17.
The questions on a multiple choice test each have 5 answer choices. Which model can be used to simulate randomly selecting the correct answer on a 20 question multiple choice test?
a)
rolling a number cube 5 times
b)
spinning a five-sided spinner 20 times
c)
flipping a coin 20 times
d)
choosing 1 marble in a bag of 20 different colored marbles
18.
How many outcomes? You can choose from 4 different ice cream flavors and 2 toppings. 
a)
12
b)
8
c)
4
d)
6
19.

Cole has two bags of marbles. The first bag contains 6 red, 5 blue, & 4 green marbles. The second bag contains 3 red, 2 blue, & 4 green marbles. Cole will randomly select 1 marble from each bag. What is the probability he selects a blue marble from each bag?

a)

5/9

b)

1/35

c)

1/6

d)

2/27

20.

Jack tossed a coin three times. Which tree diagram shows all the possible outcomes of the coin landing heads up or tails up?

a)
b)
c)
d)
21.
Describe the data distribution shape of the graph.
a)
Skewed right
b)
Skewed left
c)
Uniform
d)
Symmetrical
22.

What is shape of the data?

a)

symmetrical

b)

skewed left

c)

skewed right

d)

range

23.

Which is a true statement based on the box plots above

a)

The data for Team B have the greater range.

b)

The data for Team A are more symmetric.

c)

The data for Team B have the greater interquartile range.

d)

The data for Team A have the greater median.

24.

Which is a true statement based on the dot plots above?

a)

Set B has the greater range

b)

Set B has the greater median

c)

Set B is skewed left

d)

Set A is less symmetric that Set B

25.
Which dot plot has the greatest variability?
a)
A
b)
B
c)
C
d)
D
26.

What conclusion can Ms. Long make about the performance of her first- and second-period classes?

a)

The first-period class had a higher median score than the second-period class.

b)

Both graphs are uniform with one peak.

c)

The first-period class scores had a greater range than the second-period class scores.

d)

Both classes have the same range.

27.
a)
only 2nd period is symmetric
b)
both plots are symmetric
c)
5th period is bimodal
d)
2nd period's center is higher than 5th period
28.
a)
only Hayes Road is symmetric
b)
Hayes Road's center is at 60
c)
Jefferson Road's center is at 55
d)
only Jefferson Road is symmetric
29.
a)
the speed on Hayes Road is greater than the speed on Jefferson Road
b)
the speed on Jefferson Road is greater than the speed on Hayes Road
c)
these data sets contain no outliers
d)
the center of the data set are the same
30.
a)
only one of the data sets is symmetric
b)
the median in 1st period is greater than the median in 5th period
c)
the highest test score is the same in both classes
d)
the interquartile range is larger in 1st period than in 5th period
31.
a)
symmetric, with outliers
b)
symmetric, with no outliers
c)
skewed to the left
d)
skewed to the right 
32.

Which mean absolute deviation would be more consistent? 4.2 or 8.5?

a)

4.2

b)

8.5

33.

True or false? :The larger the Mean Absolute Deviation the more consistent the data is.

a)

True

b)

False

34.

Find the Mean Absolute Deviation: (MAD)

10, 9, 3, 8, 10.

a)

3

b)

5

c)

1

d)

2

35.

Which is the correct Mean and Mean Absolute Deviation to the following numbers?


0, 0, 5, 6, 9 and 2

a)

Mean: 3.66

MAD:3

b)

Mean: 3

MAD:3.66

c)

Mean:3

MAD:4

d)

None of the above