
 Worksheets
Economic Growth Comprehensive
Total questions: 60
Worksheet time: 45mins
1. What does the vertical axis represent on the aggregate demand curve?
Total Input
Total Output
Price Level
Both A & B

Refer to the above diagram. If the initial aggregate demand and supply curves are AD0 and AS0, the initial equilibrium price level and real output GDP will be:
F and C, respectively.
G and B, respectively.
F and A, respectively.
E and B, respectively.
If exports from New Zealand increased, what would most likely happen to real gross domestic product and price level?
Real GDP / Price Level
decrease/decrease
increase/increase
decrease/increase
increase/no chanve

Point A is the initial economic equilibrium and then the economy moves to point B, this is described as a:
Shift of the AD curve
Shift along the AD curve
Shift of the AS curve
Shift along the AS curve
What is represented on the x-axis on the AD/AS Model?
Price Level
Growth
Real Output GDP
Nominal GDP
What would cause AD to decrease?
an increase in tax rates
a decrease tax rates
an increase in government spending
keeping government spending constant
If exports from New Zealand increased, what would most likely happen to Real Output GDP and price level?
Real GDP / Price Level
decrease/decrease
increase/increase
decrease/increase
increase/no change
The only government policy with an immediate effect on the AD curve is
changing income tax rates.
changing business tax rates.
changing government spending.
changing government transfer payments.
changing the supply of money.
What will generally happen to the aggregate demand curve when consumer confidence is too low?
AD Curve shifts left
No change in the AD curve
AD Curve slopes up
AD Curve shifts right
The AD curve slopes downwards because
At high prices less is consumed in an economy
At higher prices more is sold in an economy
The AS slopes upwards
All of these reasons
If there is an increase in a nations wages (not necessarily income) then the...
AD curve shifts right
AD curve shifts left
AS curve shifts right
AS curve shifts left
Which of the following factors will not shift the AD curve right?
Increase in the cost of labour
Increase in consumer confidence
Increased exports
Increased investment
If there is an improvement in technology then the...
AD curve shifts right
AD curve shifts left
AS curve shifts right
AS curve shifts left

What are natural resources?
Resources that are gone from nature
Resources that are manufactured for the environment
Resources that are considered worthless
Materials or substances that occur in nature and can be used for economic gain

What does human capital mean?
It's the location where the most people live within a country
It's the place where the most work is performed within a country
It's the people who sell their labour to produce goods and services
It's the building where most people work in a country or state

Why should countries invest in developing human capital?
The more people you have working in one area, say producing capital, the more productive it will be
It will lead to a lower GDP
It will lead to more consumption in the economy
It will create a smarter and more productive workforce, which in turn will lead to a higher GDP

What are capital goods?
Goods that are produced in Wellington
Factories, machinery, and technology used to produce goods and services
Goods that are produced without natural resources
Goods that are produced by the government

How does entrepreneurship influence economic growth?
It creates jobs and reduces unemployment
It encourages people to take risks, in doing so create more efficient materials, products, and technologies
The more entrepreneurs a country has, the higher the country's GDP
All the above answers are correct
What is the production possibilities curve?
A graph that shows how much an economy can produce between two goods
The price of two goods in an economy
The absolute advantage one economy has over another
Land, labour, capital, entrepreneurs
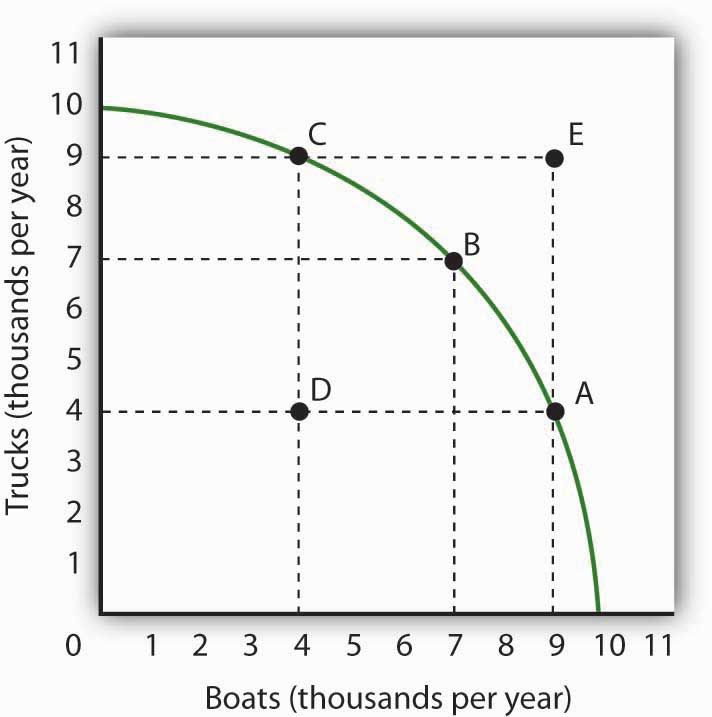
The opportunity cost of increasing production from 7,000 to 9,000 trucks is
Scarcity
2,000 boats
2,000 trucks
3,000 boats
Which of the following would consumers MOST OFTEN need to consider when trying to make a rational economic decision?
The impact of government subsidies
Potential opportunity costs
Factors of Productions
Net Exports

The opportunity cost of increasing production from 4,000 to 9,000 boats is
2,000 boat
5,000 boats
2,000 trucks
5,000 trucks
What can cause a production possibilities curve to move to the right?
Thousands of people relocate out of the country
A pandemic kills thousands of young men and women
A new invention lowers the cost of production
The population grows increasingly old
Tradeoffs, Opportunity costs, marginal costs, marginal benefits, and personal priorities are all important to consider when
Dealing with fiscal policy
Using credit
Making a rational economic choice
Responding to monetary policy

What does point B represent?
Production at greater than the country's minimum potential
Production is less than the country's minimum potential
Production is greater than the country's maximum potential
Production at the country's maximum potential
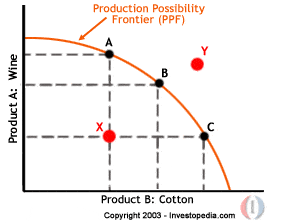
What does point Y represent on the PPC?
Efficient
Unattainable / impossible
Inefficient
Nothing
If there is improved technique of Production in both of the goods on a PPC, how will the PPC will be affected?
Leftward shift of PPC
Rightward shift of PPC
Movement outwards of the x or y axis, not both
None of the above
If the point where an economy is producing lies inside the PPF curve, this means that the economy's production is...
Over efficient/heating
Not efficient
Impossible
None of the above
Which of the following is NOT a reason for the growth of the PPF?
Accumulation of capital
Decrease in population
Technological advancement
Discovery of new mineral deposits

A movement from X to C would mean?
Consumers are more likely to purchase mobile phones.
The economy can produce more of all goods.
The economy is operating below it productive potential for all goods.
The inflation rate of all other goods must have fallen
Economic growth measures the
Growth of productivity
Increase in nominal income
Increase in output
None of the above
Economic growth can be measured by
CPI
Inflation
GDP
MPC
The rate of growth of an economy mainly depends upon
The rate of growth of the labour force
The proportion of national income saved and invested
The rate of technological improvements
All of the above
Economic growth can be seen by an outward shift of
The Production Possibility Frontier
The Gross Domestic Product
The Marginal Propensity Curve
The Closer Economic Relations
To boost economic growth the government is most likely to
Increase interest rates
Increase taxation rates
Provide incentives to invest
Provide incentives to save
In a boom
Unemployment is likely to fall
Prices are likely to fall
Demand is likely to fall
Imports are likely to fall
The Resource Management Act (1991) is about making sure NZ:
Makes efficient resources
Uses sustainable practices to protect natural & physical resources
Uses as many natural & physical resources as possible
Finds new natural & physical resources
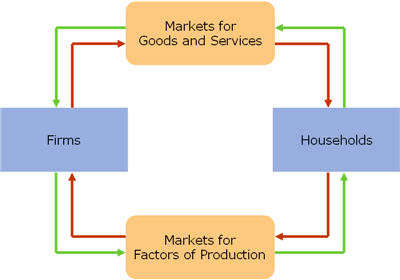
Where are factors of production (land, labor, etc) exchanged in the circular flow model?
Factor Market
Product Market
Firms
Individuals
In the circular flow diagram firms pay wages for which factor of production?
Land
Labour
Entrepreneurship
Raw materials

Which of the following is a leakage from the circular flow diagram?
Saving, Imports, un-spent tax revenue
Consumption, Exports, Government Stimulus
Loans, Interest on Loans, Investment
Imports, Exports, Money Spent on G&S
Money exchanged between businesses and individuals for labour:
Wages
Revenue
Spending
Profit
Money exchanged between an individual and a store for a good or service.
Revenue
Wages
Rent
Donation
Which statement is true about the circular flow diagram? [Product Market: where final G&S are sold. Factor Market: factors of production (land, labour...)]
Households are demanders in the product market and suppliers in the factor market
Businesses are demanders in the product market and suppliers in the factor market.
Households are demanders in the factor market and suppliers in the product market.
Businesses and households are not components of the circular flow diagram.
Which of the following is a measure of economic growth?
Real GDP per capita
Productive Capacity
Net Social Welfare
All of the above
Which of the following is NOT a factor of production?
Land
Labour
Capital
Goods and services
What do households provide to the resource market?
Land, labour, capital, and entrepreneurship
Money
People
Income
Net Social Welfare is:
Quantitative
Qualitative

What do you earn from a business?
Wages
Income
Savings
Investment
According to the Circular Flow chart, which of the following statements is true?
Government receives its revenue only from the factor market
Government receives its revenue only from the product market
Government receives its revenue from transfer payments
Government receives its revenue from direct tax (households) and indirect tax (firms)
Which of the following is a injection into the circular flow diagram?
Saving, Imports, un-spent tax revenue
Increased Consumption, Exports, Government Stimulus
Loans, Interest on Loans, Investment
Imports, Exports, Money Spent on G&S

