
NEW
Font size
S
M
L
XL
 Worksheets
163 Graphing and Speed Quiz
Total questions: 24
Worksheet time: 2hrs 7mins
Name
Class
Date
1.

Determine the speed of a golf ball that was hit 200meters in 5 seconds. Use the equation SPEED = DISTANCE/TIME
a)
1000 m/s
b)
40 m/s
c)
.025 m/s
d)
100 m/s
2.

Determine the speed at 20 seconds based on the information shown in the graph. Speed = distance/time
a)
2 m/s
b)
10 m/s
c)
20 m/s
d)
.5 m/s
3.

Determine if the object was accelerating between 40 seconds and 60 seconds.
SPEED = DISTANCE/TIME
SPEED = DISTANCE/TIME
a)
No, the speed stayed the same
b)
Yes, the speed increased
c)
Yes, the speed decreased
d)
Yes. the speed stayed same
4.
What two measurements are necessary for calculating speed?
a)
Mass and time
b)
Temperature and mass
c)
Mass and distance
d)
Distance and time
5.

At 60 seconds, how far had this object traveled?
a)
0 m
b)
10 m
c)
20 m
d)
40 m
6.

How many times does this object STOP moving?
a)
None
b)
Once
c)
Twice
d)
Three times
7.
Can be measured in seconds (s)
a)
Distance
b)
Time
c)
Speed
d)
Acceleration
8.
Can be measured in meters (m)
a)
Distance
b)
Time
c)
Speed
d)
Acceleration
9.
A cricket can travel approximately 8 feet per minute. How many feet could a cricket travel in 75 minutes?
a)
83 feet
b)
9.375 feet
c)
180 feet
d)
600 feet
10.
A rocket traveled 90 meters in 45 seconds. How fast did it travel?
a)
2 km/s
b)
2 m/s
c)
5 m/s
d)
1 m/s
11.

A school bus drives 35 mph down the street and slows as it approaches the stop sign. This is an example of..
a)
acceleration
b)
speed
c)
velocity
d)
force
12.

In which free body diagram will the forces acting on the box result in it moving up and to the right?
a)
box 1
b)
box 2
c)
box 3
d)
box 4
13.

Tim went skydiving and fell down to the earth at 35mph south. This describes Tim's...
a)
speed
b)
velocity
c)
acceleration
d)
Force
14.
Which of the following is a unit of speed ?
a)
sec
b)
mi
c)
m/s
d)
min
15.

What does this graph represent?
a)
Constant Speed
b)
Acceleration
c)
Deacceleration
d)
Not moving
16.

What is the person doing from 5 seconds to 10 seconds?
a)
Walking
b)
Running
c)
Standing Still
d)
Walking Fast
17.

What is the speed of this object at 3 seconds?
a)
5 m/s
b)
45 m/s
c)
5 s/m
d)
45 s/m
18.

The graph shows
a)
positive velocity that's getting faster
b)
negative velocity that's getting faster
c)
negative velocity that's getting slower
d)
positive velocity that's getting slower
19.

The graph shows
a)
positive velocity that's getting faster
b)
negative velocity that's getting faster
c)
negative velocity that's getting slower
d)
positive velocity that's getting slower
20.
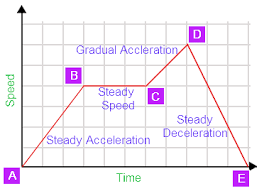
At what point is the speed the greatest?
a)
C-D
b)
B-C
c)
A-B
d)
D-E
21.
Match the graph to the description:
"The car is traveling at a constant speed."
a)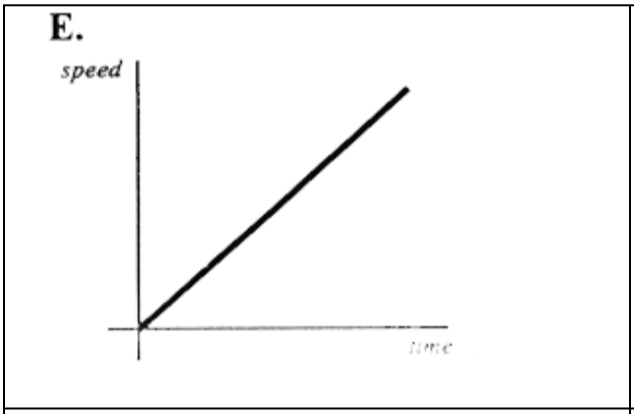
b)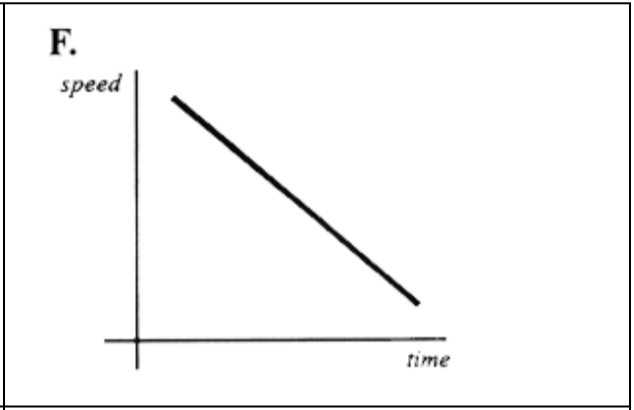
c)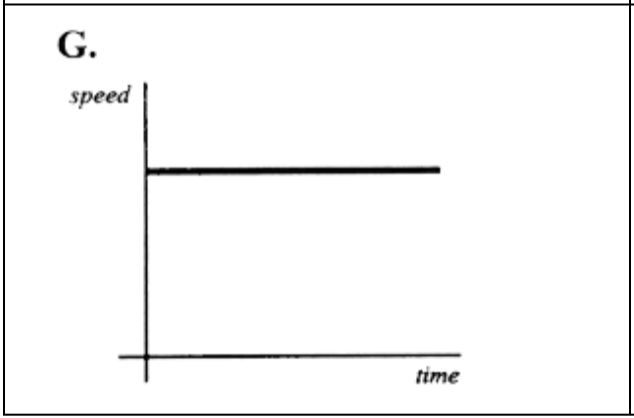
d)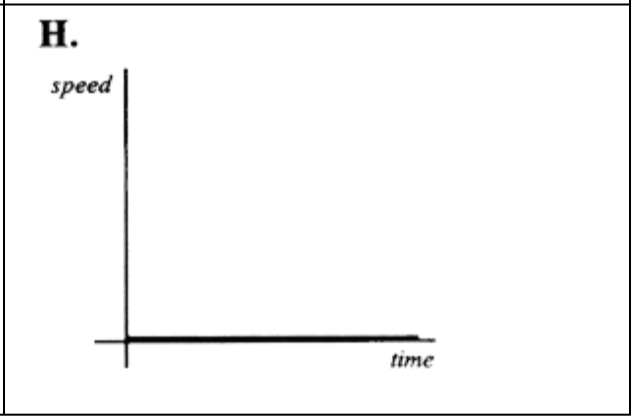
22.
Match the graph to the description:
"The car is accelerating."
a)
b)
c)
d)
23.
Match the graph to the description:
"The car is slowing down."
a)
b)
c)
d)
24.
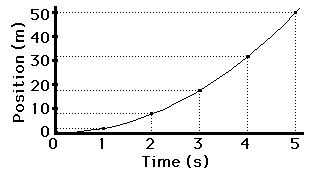
The picture of the position vs. time graph shows an object that is...
a)
accelerating/speeding up
b)
moving at a constant speed
c)
not moving
d)
accelerating/slowing down.
Reset

