
NEW
Font size
 Worksheets
Probability & Statistics Semester exam-DEC2022
Total questions: 40
Worksheet time: 1hrs 7mins
Rolling a pair of dice, find P(sum is 7 or 11).
50%
16%
17%
22%





What is the mean for the stem and leaf plot? Given 3/2=32
32.3
32.8
32.9
33.4
84, 88, 72, 74, 98, 16, 94




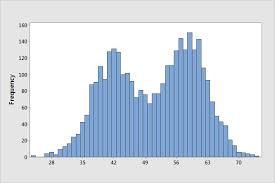
What is the shape of the distribution?
Skewed Left
Skewed Right
Symmetric
Bimodal

How would you describe this data?
Symmetrical
Skewed Left
Skewed Right
Tails

Raawi asks his classmates if they have brown hair or wear glasses. B = {students with brown hair} and G = {students with glasses}. His results are shown in the Venn diagram. How many students have brown hair?
13
16
20
22


If you draw one card from a standard deck, what is the probability of drawing a 5 or a diamond?
2/52
4/52
4/13
26/52
Sonia has 5 yellow hair clips, 2 red hair clips, and 3 blue hair clips in her purse. What is the probability that she will randomly select one yellow hair clip and one blue hair clip without replacement?
203
61
5615
158
A bag contains 5 red marbles, 4 blue marbles, and 3 green marbles. Joshua will select a marble at random, record its color, and then put the marble back in the bag. He will select three marbles in this way. What is the probability that Joshua will first get a red marble, then a blue marble, and then a green marble?
601
1445
125
6047

What percent of the annual sales were washers?
20%
30%
25%
0.20%

If a fisherman caught 1000 kilograms of fish, how many kilograms of catfish did he catch?
20 kg
200 kg
25 kg
50 kg
What angle would you use to represent 40 red cars out of 90 cars in total on a pie chart?
40 degrees
160 degrees
4 degrees
90 degrees
Which graph organizes data in vertical bars from largest to smallest?
pareto graphs
bar graphs
histograms
ogive graphs

The total or cumulative frequency of the data shown by the ogive below is...
10
40
83
104

The diagram shows the sports played by 80 students.
If a student is picked at random, what is the probability that they play football only?
66/80
4/80
18/80
49/80


What percentage of the data sits above the right end of the box (Q3) in a boxplot?
25%
50%
75%
100%

Observe the frequency distribution:
What is the cumulative frequency of the third class?
f1 + f2 + f3 = 5 + 8 + 6 = 19
f1 + f2 + f3 = 5 + 6 + 10 = 21
f1 + f2 + f3 = 1 + 6 + 11 = 18

Observe the frequency distribution:
Estimate the relative frequency of the fourth class.
69
5.3
0.189 or 18.9%
0.54 or 54%

Observe the histogram and choose the frequency distribution that corresponds to it.


Then, 68% of all tires will have a life between ___________ km and __________ km.

Find the percent of the shaded region.
0.16
0.84
0.68
0.34
A line up for tickets to a local concert had an average (mean) waiting time of 20 minutes with a standard deviation of 4 minutes. If 2000 ticket buyers were in line, how many of them would expect to wait for less than 16 minutes?
320
1550
100
30
A data set has a mean of 290 and a standard deviation of 20. Calculate the z-score for 265.
z=250.5
z=1.25
z=−1.02
z=−1.25
A data set has a mean of 300 and a standard deviation of 40. What value would have a z-score of z=−2 ?
298
296
220
380

Use the image of the normal graph provided. What is the value of the standard deviation?
6
12
36
18

