
 Worksheets
Test 1 Review
Total questions: 50
Worksheet time: 2hrs 36mins

How many tiles would be in Figure 0?
0
1
2
10
Select Figure 0 below.


How many tiles would be in Figure 4?
0
12
8
10
Select Figure 4 below.

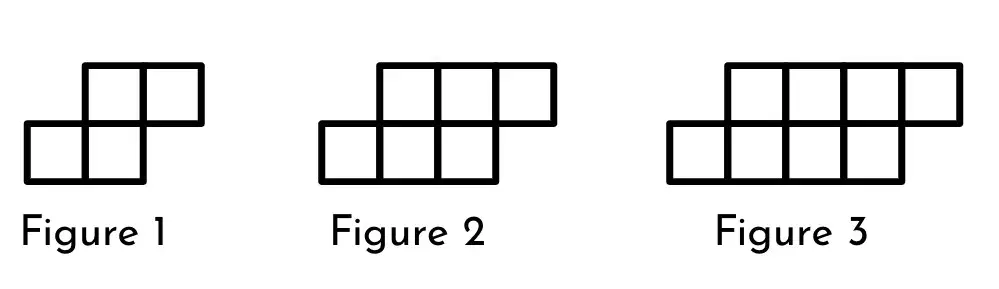
Use your answers to the previous questions to write an equation for the tile pattern.
y=2x
y=2
y=2x+4
y=2x+2

Write an equation for this situation.
D = number of days (input)
C = total cost (output)
D = 19.25C
D = 19C
C = 19.25D
C = 19D


Formulate the linear equation for the table given.


y = 5x + 4
y = 4x + 5
(-3, 3) and (7, 6)
0.75
-1.33
0.3
-3.33

Determine the slope and y-intercept from the following equation: y = 1.5x + 3
slope: 1.5 y-intercept: (0,3)
slope: 4 y-intercept: (0,1.5)
slope: 0.2 y-intercept: (0,5)

y = -5x + 1?
y=5x+3
y=2x+5

What is the slope of the table?
1/2
7
2
1/7
f(x) = x+7 find the output when the input is 1.
5
6
7
8
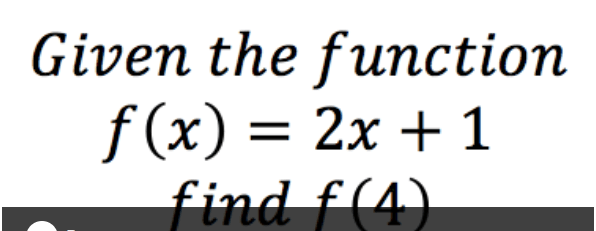
Given the function f(x)=2x+1, find the output when the input is 4.
8
1.5
0.67
9

Given f(x)=2x+1, find the input that produces an output of 16.
8
7.5
7
-7

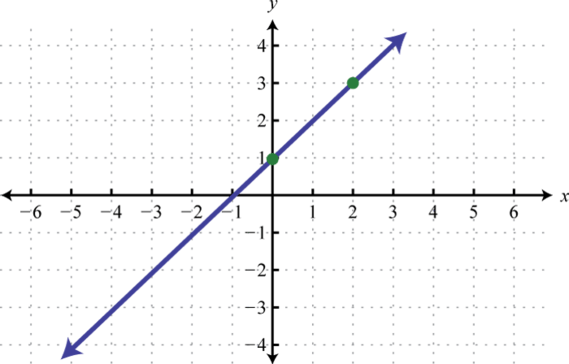
Find the output for an input of -2 in this graph.
10
4
-3
2

What input produces an output of 3 on this graph?
-2
-6
-1
-5

A restaurant sells pizza for the prices in the data table. Find the correlation coefficient and explain what it means. Choose the BEST answer.
r = 1. The relationship between number of toppings and price is exactly linear.
r = 1. The relationship between number of toppings and price is strong.
r = 0.9999 The correlation coefficient looks like it is 1 until you increase the number of decimals. The relationship is strong.
r = -1. The relationship is exactly linear.
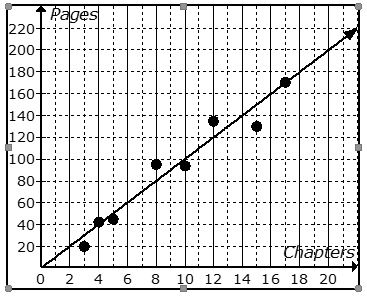


Which correlation coefficient matches the scatterplot?
r = 0.95
r = -0.89
r = -0.39

Which correlation coefficient matches the scatterplot?
r = 0.95
r = -0.89
r = -0.39

Which correlation coefficient matches the scatterplot?
r = 0.95
r = -0.89
r = -0.39
Data was collected on the weight of a male laboratory rat for the first 25 weeks after its birth. The linear regression equation is
y= 40x+100, where x is number of weeks and y is weight in grams.
What does the slope mean in context of the problem?
The predicted weight of the after 25 weeks.
The average increase in the rat's weight per week.



Estimate the correlation coefficient for this scatterplot.
r = 1.2
r = 0.89
r = 0
r = -0.89
The equation y = -2x + 7 models the amount of gas remaining in a lawnmower after x hours of use since it was filled. What is the meaning of the slope?
For each hour of mowing, the mower is predicted to use 2 gallons.
the predicted amount of gas the lawnmower can hold is 2 gallons
For every two hours of mowing, the mower is predicted to use 7 gallons.
The predicted amount of gas remaining after 1 hour is 2 gallons.
Rich is a member of a gym. He pays a monthly fee plus a per-visit fee. The equation below represents the monthly amount Rich pays for his membership to the gym per month for x visits.
y= 10 + 3x
What does the y-intercept of the graph of this equation represent?
The monthly fee
How much Rich pays per visit
The number of times Rich goes to the gym
The total cost at the end of the month
Rita wants to predict the value of her car. She collects data on six other used cars. The data includes how old the car is, how many miles it has, and the price the car sold for.
She finds the linear regression equation for age of the car (input) versus price (output) and gets a correlation coefficient of 0.89.
Then she finds the linear regression equation for mileage on the car (input) versus price (output) and gets a correlation coefficient of 0.43.
Which model should Rita use to predict the price of her car?
age of car vs. price
mileage of car vs. price
both models are equally good
neither model is good; she should not use them to predict the price of the car
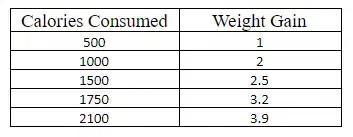
Find the line of best fit (linear regression equation) for an input of calories consumed and an output of weight gain. Set GeoGebra to 3 decimals.
y = 0.002x + 0.123
y = 0.002x
y = 561.44x - 44.83
y = 500x
Find the correlation coefficient for the linear regression model.
r = 0.35
r = 0.92
r = 0.99
r = 0.67
Based on the correlation coefficient, what do we know about the linear regression model?
The relationship is negative and strong
The relationship is positive and moderate
The relationship is positive and weak
The relationship is negative and moderate
The relationship is positive and strong
Use the linear regression equation to predict weight gain if 3000 calories are consumed.
6 or 7 depending on how you use GeoGebra
5.371 or 6.123 depending on how you use GeoGebra
4.861 or 5.869 depending on how you use GeoGebra
5.982 or 6.043 depending on how you use GeoGebra

The water level of a tank is changing at a constant rate. The graph shows the relationship between the time in hours and the water level in meters. Which value best represents the rate of change of the water level with respect to time?
31 meters per hour
−31 meters per hour
3 meters per hour
−3 meters per hour
y= 40x+100, where x is number of weeks and y is weight in grams.
What does the y-intercept mean in context of the problem?
The predicted weight of the rat after 25 weeks.
Data is analyzed comparing hours studied and grades. It is determined that the correlation coefficient is 0.92. What does this mean?
There is a strong positive correlation between studying and grades.
There is a strong negative correlation between studying and grades.
There is a weak positive correlation between studying and grades.
There is a weak negative correlation between studying and grades.

