
 Worksheets
Bivariate Correlation
Total questions: 25
Worksheet time: 13mins
A study compared the number of cars a person owns and that person’s average yearly salary. It was determined that the relationship between these two quantities was linear and the correlation was 0.37. Which conclusion can be made on the findings of this study?
There was a weak relationship.
There was a strong relationship.
There was no relationship.
Unpredictable.
Which value of r represents data with a strong negative linear correlation between two variables?
-0.86
-0.50
0.89
0.07
Correlation coefficients are:
A point that does not fit the overall pattern.
A histogram.
A numerical measure of the direction and strength of a linear association.
A graphical display.
Which correlation coefficient shows the strongest linear relationship between x and y?
0.97
-0.02
0.86
-0.99
Which value of r represents data with a strong positive linear correlation between two variables?
-1.07
1.04
0.86
0.48



Estimate the correlation coefficient for this scatterplot.
A) r = 1.2
B) r = 0.89
C)r = 0
D) r = -0.89

Estimate the correlation coefficient for this scatterplot.
A) r = -0.9
B) r = 1
C) r = 0.9
D) r = -1
A correlation value (r) that has a strong, positive linear association would have a value close to
1
0
-1
Cannot be answered
What would be an appropriate correlation (r) relating the number of kids you have and the number of points the Vikings score in a game?
r = 1
r = 0.43
r = 0
r = - 0.35
r = -1
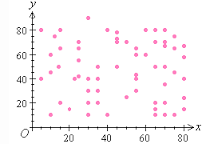
What type of correlation does this graph show?
A) Positive
B) negative
C) none
D) all of the above
Temperature of a rubber band and distance the rubber band can stretch. r=.84
strong positive
strong negative
weak positive
weak negative
Number of steps taken per day and number of kilometers walked per day. r=.92
strong positive
strong negative
weak positive
weak negative
Car weight and distance traveled using a full tank of gas. r=−.86
strong positive
strong negative
weak positive
weak negative
Average fat intake per citizen of a country and average cancer rate of a country. r=.73
strong positive
strong negative
weak positive
weak negative
Score on science exam and number of words written on the essay question. r=.28
strong positive
strong negative
weak positive
weak negative
Average time spent listening to music per day and average time spent watching TV per day. r=−.17
strong positive
strong negative
weak positive
weak negative

