wayground logo

Free Printable Worksheets

Font size

S
M
L
XL
Worksheets

UIL A+ Maps, Graphs, & Charts

Total questions: 115

Worksheet time: 3hrs 10mins

Name
Class
Date
1.

What is a compass rose?

a)

half of a circle that helps people find angles

b)

a drawing showing different directions on a map

c)

a device with a magnet that always points North

d)

a pretty flower on a map that is red

2.

What is a scale on a map?

a)

a tool that allows you to measure your body weight

b)

a way to balance the weights of the land and oceans

c)

a ratio of the distance on the map to the actual distance

d)

a piece of skin found on reptiles like snakes

3.

What does the title show on a map?

a)

shows the person who made the map

b)

attracts the reader's attention

c)

shows the purpose of the map

d)

shows important information about the size

4.

Which choice is the legend or key of a map?

a)
b)
c)
d)
5.

Which map is a 'birds eye view' map?

a)
b)
c)
d)
6.

Which map is a 'political map'?

a)
b)
c)
d)
7.

What does the "N" on the compass rose stand for?

a)

North

b)

Napa

c)

Norway

d)

Nevada

8.
A way of showing the actual size compared to the size on the map
a)
legend/key
b)
cardinal directions
c)
compass rose
d)
map scale
9.
Another name for a Key is 
a)
Lock
b)
Meridian
c)
Legend
d)
Parallel
10.
What direction would you travel in to get from Perth to Sydney
a)
North
b)
East
c)
South 
d)
West
11.
What direction would you travel in to get from Adelaide to Darwin
a)
North
b)
East
c)
South 
d)
West
12.
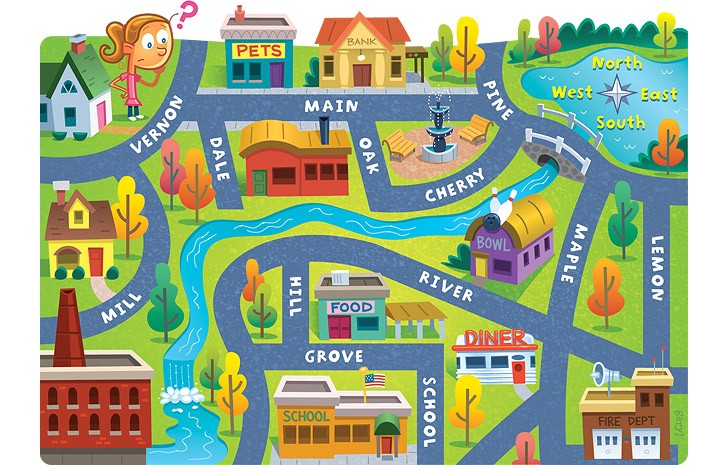
The fire dept. is ______ of the school.
a)
South
b)
East
c)
North
d)
West
13.
The school is ____ of the pet store.
a)
North
b)
South
c)
East
d)
West
14.
Catherine's house is in the __ corner of the map.
a)
northern
b)
southern
c)
northwestern
d)
northeastern
15.
What directions would you travel to go from Catherine's house to the school?
a)
northeast
b)
northwest
c)
southeast
d)
southwest
16.
What is this?
a)
map scale
b)
map key
c)
map title
17.

What direction does the red X represent?

a)

Northeast

b)

Northwest

c)

Southeast

d)

Southwest

18.

What direction does the red X represent?

a)

North

b)

South

c)

East

d)

West

19.

What direction does the red X represent?

a)

North

b)

South

c)

East

d)

West

20.

What direction does the red X represent?

a)

North

b)

South

c)

East

d)

West

21.

What direction does the red X represent?

a)

North

b)

South

c)

East

d)

West

22.

What direction does the red X represent?

a)

North

b)

South

c)

East

d)

West

23.

What are the four cardinal directions?

a)

North, South, Windy, Sunny

b)

Never Eat Slimy Worms

c)

North, South, East, West

d)

South Never Eat West

24.

What does the red line in the picture show?

a)

states

b)

Equator

c)

continents

d)

countries

25.

Tells distance on a map in kilometers and miles

a)

key

b)

title

c)

compass rose

d)

scale

26.

It refers to the exact point where an object or place is.

a)

Absolute location

b)

Continental Location

c)

Maritime Location

d)

Relative Location

27.

It is a measurement that shows how far north or south a place is from the Equator which is at 0 degrees.

a)

Coordinates

b)

Latitude

c)

Longitude

d)

Meridians

28.

It is a measurement that shows how far east or west of the Prime meridian which is at 0 degrees.

a)

Coordinates

b)

Latitude

c)

Longitude

d)

Meridians

29.

It is created when longitude and latitude lines intersect.

a)

Map

b)

Plane

c)

Quadrants

d)

Grid

30.

On which part of a map will you be able to see the measurements for latitudes?

a)

Top and bottom of the map

b)

Sides of the map

c)

Center of the map.

d)

Back of the map.

31.

Latitude Lines run ____________ to ____________.

a)

East to West

b)

North to South

32.

Latitude measures the distance ______________ and __________________ of the ________________.

a)

North, South, Equator

b)

East, West, Prime Meridian

c)

North, South, Prime Meridian

d)

East, West, Equator

33.

Longitude measures distance ____________ and _______________ of the ___________________.

a)

East, West, Prime Meridian

b)

North, South, Prime Meridian

c)

East, West, Equator

d)

North, South, Equator

34.

Which Hemisphere is this location found: 700 N Lat., 1430 E Long.

a)

North

b)

South

c)

North Eastern

d)

Eastern

35.

Which Continents are completely in the Northern Hemisphere? Check all that apply.

a)

North America

b)

Europe

c)

Asia

d)

South America

e)

Africa

36.
Which Continent is home to 36% of the wild cats?
a)
Asia
b)
Africa
c)
North America
d)
South America
37.
Which Continent is home to 13% of wild cats?
a)
Asia
b)
Africa
c)
North America
d)
South America
38.
Which Continent has the smallest % of wild cats?
a)
Asia
b)
Europe
c)
North America
d)
South America
39.
How many total votes were collected?
a)
5
b)
10
c)
15
d)
20
40.
Which pizzeria has the second largest sales? 
a)
Pizza House
b)
Domiano's Pizza
c)
Little Secrets Pizza
d)
Uncle John's Pizza
41.
What percentage does a whole circle graph represent?
a)
360%
b)
90%
c)
50%
d)
100%
42.

The pie chart shows the colours of 32 beads. How many green beads are there?

a)

90

b)

8

c)

11

d)

9

43.

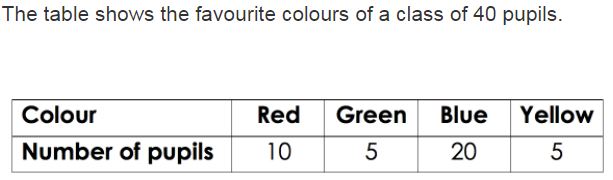
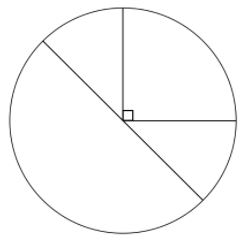
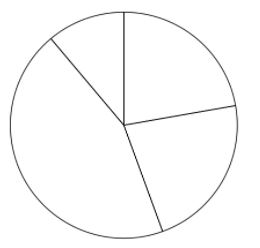
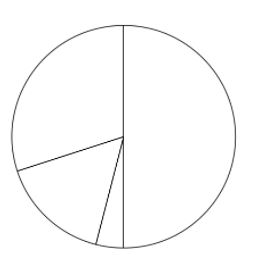
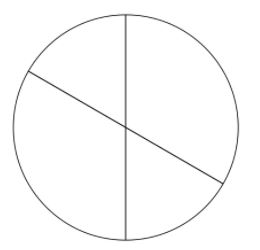
Which pie chart represents the same data as the table?
a)
b)
c)
d)
44.

Look at the Bar Graph "Student Grades". Which grade did the smallest number of students get?

a)

A

b)

B

c)

C

d)

D

45.
Which day had more minutes of homework?
a)
Wednesday
b)
Thursday
c)
Friday
d)
Ms. Jones
46.
How many students' favorite color is blue?
a)
11
b)
12
c)
14
d)
17
47.
How many votes did reading receive?
a)
2
b)
4
c)
6
d)
8
48.

Look at the Bar Graph, "Student Grades". What grade did the most students get?

a)

A

b)

B

c)

C

d)

D

49.
How many more students like soccer than basketball?
a)
24
b)
15
c)
10
d)
17
50.
How many students like hockey and football?
a)
21
b)
3
c)
12
d)
9
51.
How many students voted for their favorite sport?
a)
38
b)
17
c)
40
d)
50
52.
What type of graph is this?
a)
bar graph
b)
pictograph
c)
tally chart
53.

The most popular fruit is ....

a)

pear

b)

strawberry

c)

banana

54.

The least popular fruit is ....

a)

pear

b)

strawberry

c)

orange

55.

Which month had the greatest number of books read?

a)

November

b)

December

c)

January

d)

February

56.

Which month had the fewest books read?

a)

January

b)

February

c)

March

d)

April

57.

An outlier is..

a)

a number that is repeated the most in the data.

b)

a number that is the highest in the data.

c)

a number that is the lowest in the data.

d)

a number that is either much greater than or less than any other numbers in the data.

58.

How old are you?

a)

Categorical

b)

Numerical

59.

In which month were you born?

a)

Categorical

b)

Numerical

60.

What is your favorite subject in school?

a)

Categorical

b)

Numerical

61.

How many brothers do you have?

a)

Categorical

b)

Numerical

62.

Which bar graph is the same as the data in the circle graph if 20 people were surveyed?

a)
b)
c)
d)
63.

Which circle graph has the same data as the bar graph?

a)
b)
c)
d)
64.

Sixty people were surveyed about their favorite Candy. The results are show in the circle graph. Which bar graph is the same data?

a)
b)
c)
d)
65.

The bar graph shows pizza toppings students enjoy. Which circle graph displays the same data?

a)
b)
c)
d)
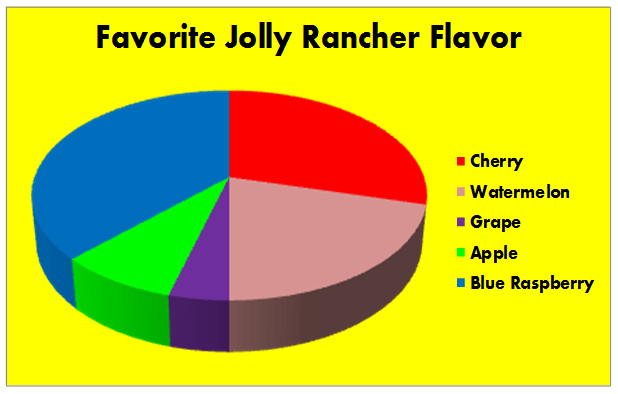
66.
According to this graph, what is the most popular flavor of Jolly Rancher?
a)
Cherry
b)
Grape 
c)
Blue Rasberry
d)
Watermelon
67.
All 25 students in our class were surveyed about what their favorite food is.  11 students chose pizza. What percentage of the class chose pizza?
a)
20%
b)
44%
c)
15%
d)
60%
68.
How many total people took the survey?
a)
50
b)
150
c)
100
d)
200
69.

Graphs are tools that help:

a)

Organize data

b)

Perform calculations

c)

Solve Problems

d)

Gather information

70.

You can find an explanation of what a graph's symbols mean in the:

a)

Key

b)

Data

c)

X-axis

d)

Y-axis

71.

Each of the following graphs has an x- and y-axis, except:

a)

Pie chart

b)

Bar graph

c)

Line graph

d)

Scatter plot

72.

What does this scatter plot indicate about the relationship between age and salary?

a)

As age increases, salary decreases

b)

As age increases, salary increases

c)

Salary peaks at age 35 and then decreases

d)

There is no relationship between salary and age

73.

Which kind of graph would best show how the price of bread has changed over time?

a)

Bar graph

b)

Pie graph

c)

Line graph

d)

Dot graph

74.
What is the name of this graph?
a)
line plot
b)
line graph
c)
bar graph
d)
frequency table
75.
What is the main purpose of a line graph?
a)
to compare two things
b)
to show trends over time
c)
to have an independent variable
d)
so you don't have to read words
76.
What is the general trend of this line graph?
a)
The more you mow, the less money you make.
b)
You make the same amount of money regardless of how long you mow.
c)
The more you mow, the more money you make.
d)
Mowing is dangerous.
77.
At which age do the least amount of teens have a cell phone?
a)
18
b)
14
c)
13
d)
15
78.
The coordinates for the origin in the coordinate plane are________?
a)
(1,1)
b)
(0,0)
c)
(0,1)
d)
(1,0)
79.
The X axis is _______?
a)
vertical
b)
diagonal
c)
criss-cross
d)
horizontal
80.
The Y axis is _______?
a)
Vertical
b)
Horizontal
c)
criss-cross
d)
diagonal
81.

What is the slope of the table?

a)

15

b)

6

c)

1/6

d)

-6

82.
What type of slope?
a)
undefined
b)
positive slope
c)
negative slope
d)
zero slope
83.
What is the slope?
a)
5
b)
1/5
c)
15
d)
10
84.
What type of slope?
a)
negative
b)
positive
c)
zero slope
d)
downward slope
85.
What is the slope?
a)
0
b)
Undefined
c)
4
d)
1/4
86.
What type of slope?
a)
negative
b)
steep
c)
undefined
d)
zero slope
87.
Shannon has a bag of jelly beans. She removed one jelly bean, recording the color, and then replaced it. She repeated the process several times and record her results in the table. What is the experimental probability of her selecting a red jelly bean?
a)
11/33
b)
1/3
c)
1/4
d)
18/26
88.
What is the definition of function?
a)
Has inputs and outputs
b)
Every input has only ONE output
c)
Inputs have different outputs every time
d)
x-values and y-values
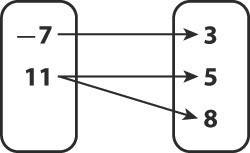
89.
Is the relation a function? Why.
a)
Yes, because the x-value 11 has two y-values pair with it.
b)
Yes, because each x-value has only one y-value paired with it.
c)
No, because the x-value 11 has two y-values pair with it.
d)
No, because each x-value has only one y-value paired with it.
90.
Is this table a function or not a function? 
a)
Function
b)
Not a Function
91.
Is this mapping a function or not a function? 
a)
Function
b)
Not a Function
92.
Is this mapping a function or not a function? 
a)
Function
b)
Not a Function 
93.
Is this relation a function?
a)
Yes, because the x-value 1 has two y-values
b)
Yes, because each x-value has only one y-value
c)
No, because the x-value 1 has two y-values
d)
No, because each x-value has only one y-value
94.

Which programs are used to calculate spreadsheets?

a)

Microsoft publisher & Google templates

b)

Microsoft excel & Google sheets

c)

Microsoft powerpoint & Google slides

d)

Microsoft word & Office 365

95.

Is a column vertical or horizontal?

a)

vertical

b)

horizontal

96.

A pie chart is used to do what?

a)

show trends over time

b)

represent only one series of data

c)

show the correlation of two or more sets of data

d)

show how many pieces you can eat

97.

Why are charts/graphs used in spreadsheets?

a)

to show a visual of the data in a spreadsheet

b)

to make the spreadsheet look cool

c)

to backup the data you input into the spreadsheet

d)

all of these are reasons

98.
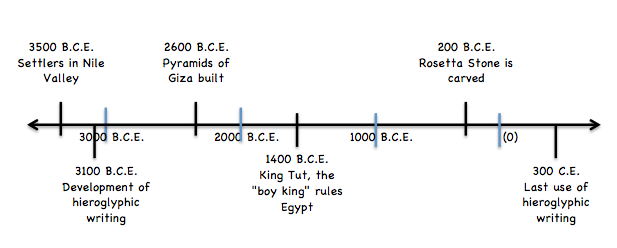
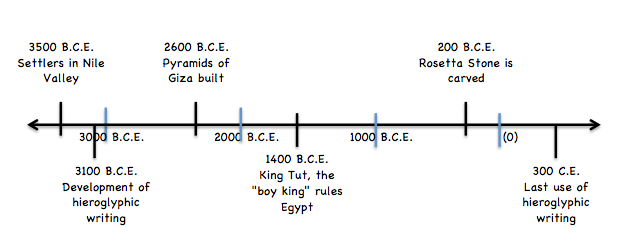
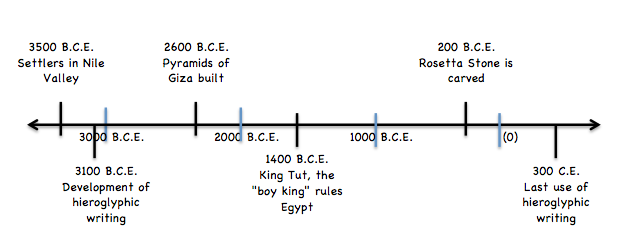
Which event on this timeline happened FIRST
a)
Last use of hieroglyphic writing
b)
Rosetta Stone is carved
c)
Settlers in Nile Valley
d)
Development of hieroglyphic writing
99.
How many years passed between the development of hieroglyphic writing and the carving of the Rosetta Stone
a)
3,300 years
b)
3,200 years
c)
2800 years
d)
2,900 years
100.
How many years passed between the release of the first iPod and Barack Obama being elected President
a)
5 years
b)
6 years
c)
7 years
d)
8 years 
101.

Which year happened first?

a)

567 B.C.

b)

525 A.D.

102.

Which year happened first?

a)

417 A.D.

b)

1225 A.D.

103.

Which year happened first?

a)

2018 A.D.

b)

2018 B.C.

104.

Which year happened first?

a)

452 B.C.E.

b)

789 B.C.E.

105.

Which year happened first?

a)

1789 C.E.

b)

1789 B.C.E.

106.
Which timeline is labeled correctly?
a)
A
b)
B
c)
C
107.
Which timeline is labeled correctly?
a)
A
b)
B
c)
C
108.
Choose the timeline that correctly labels the following events.
1500 B.C.E. Hinduism is founded in India 
2085 B.C.E.   Judaism is founded by Abraham

30 C.E.  Christianity is founded by followers of Christ 
610 C.E.  Islam is founded by followers of the Prophet Mohammed
a)
A
b)
B
c)
C
109.
How many years passed between the settlement of the Nile Valley and the building of the Pyramids of Giza? 
a)
3,300 Years
b)
900 Years
c)
5,100 Years
d)
1,100 Years
110.
How many years passed between King Tut's rule of Egypt and the last use of hieroglyphic writing? 
a)
1,600 Years
b)
1,100 Years
c)
1,700 Years
d)
4,700 Years
111.
Who ruled ancient Mesopotamia while Pharaoh Teti ruled Egypt? 
a)
King Hammurabi
b)
King Sargon
c)
Pharaoh Thutmose
d)
Pharaoh Teti
112.
Which set of dates is in the correct chronological order?
a)
1900, 1800, 1700, 1600
b)
1600, 1800, 1700, 1900
c)
1700, 1800, 1900, 1600
d)
1600, 1700, 1800, 1900
113.
What happened right BEFORE the person ate breakfast?
a)
He got dressed
b)
He caught the bus
c)
He brushed his teeth
114.
What span of time is used on this timeline? 
a)
1850s
b)
1850-2000
c)
1865-1968
d)
1850-1950
115.
Timelines must be in _____________ order
a)
newest to oldest
b)
guess
c)
no
d)
chronological