
 Worksheets
Term 4 Final Exam Review
Total questions: 42
Worksheet time: 4hrs 30mins
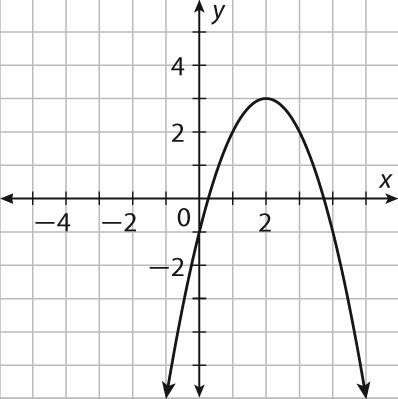
What is the range of the function?
y ≤ 3
y≥ 2
All real numbers
-6 ≤ y ≤ 3

What is the range?
y ≤ -3
y≥−1
All real numbers
y ≤ -1


What steps transform the graph y = x2 to y = -1/2(x-4)2 + 1?
Compressed by 1/2, shifted 4 units right and 1 unit up
Reflected across x-axis, compressed by 1/2, shifted 4 units right and 1 unit up
Reflected across x-axis, stretched by 1/2, shifted 4 units left and 1 unit up
Stretched by 1/2, shifted 4 units right and 1 unit down
What steps transform the graph y = x2 to y = 2(x+2)2 - 5?
Compress by 2, shifted 2 units left and 5 down
Stretch by 5, shifted 5 units left and 2 down
Stretch by 2, shifted 2 units left and 5 down
Compress by 5, shifted 2 units left and 2 down
What steps transform the graph y = x2 to y = (x-4)2
Shifted down 4 units
Shifted left 4 units
Shifted right 4 units
Shifted up 4 units


Solve x2− 4 = 12
2 and -2
4 and -4
16 and -16
8 and -8
Solve:
x2 - 49 = 0
x = -7, x = 7
x = -7
x = 7
x = -7, x = 1
4x2 + 4x + 1 = 0
x2 + 2x - 24 = 0


2n2-8n3
24c5 - 12c3
Solve using the Quadratic Formula
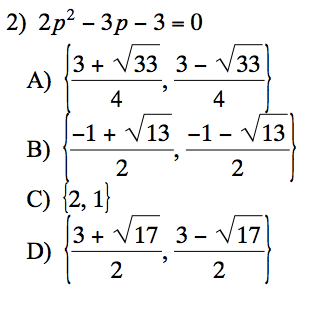
4v2 - 1v - 18 = 0
v = 2.25, -2
v = -2.25, 2
v = 2.24, -1.99
v = -2.24, 1.99

Which scatter plot shows a linear relationship between x and y?
Graph A
Graph B
Graph C
Graph D
Number of steps taken per day and number of kilometers walked per day. r=.92
strong positive
strong negative
weak positive
weak negative
Average time spent listening to music per day and average time spent watching TV per day. r=−.17
strong positive
strong negative
weak positive
weak negative

Estimate the correlation coefficient for this scatterplot.
A) r = 0.5
B) r = 0.89
C)r = 0
D) r = -0.89
Find the median, first quartile, third quartile, and interquartile range of the data.
203, 183, 212, 181, 157, 204, 189, 190
Median: 189
First Quartile: 182
Third Quartile: 203
IQR: 21
Median: 189.5
First Quartile: 182
Third Quartile: 203
IQR: 21
Median: 189
First Quartile: 182
Third Quartile: 203.5
IQR: 21.5
Median: 189.5
First Quartile: 182
Third Quartile: 203.5
IQR: 21.5
What is the IQR of the following Data Set:
32, 35, 35, 36, 39, 40, 44, 48, 49
Q1: 35
Q2: 39
Q3: 46
IQR: 46 - 35 = 11
Q1: 35
Q2: 39
Q3: 44
IQR: 44 - 35 = 9
Q1: 35
Q2: 39
Q3: 48
IQR: 48 - 35 = 13
Q1: 35
Q2: 39
Q3: 46
IQR: 39 - 35 = 4

C = 2πr, for r
Find f(x) = g(x)
f(x) = 2/3x - 2
g(x) = -x + 3
(0,3)
(0,-3)
(3,0)
(-3,0)


Write an expression for the perimeter in simplest radical form

The slope of Function A is greater than the slope of Function B.
The slope of Functions A is less than the slope of Function B.

The y-intercept of Function A is greater than the y-intercept of Function B.
The y-intercept of Function A is less than the y-intercept of Function B.

What is the average rate of change 4<x<6
-4
4
1/4
-4/2

Find the average rate of change 4<x<5
-10
2
1/10
1/2
Which scatter plot shows a quadratic relationship between x and y?
Graph A
Graph B
Graph C
Graph D

