
 Worksheets
Unit 2 Test: Microeconomics (Fall 2021)
Total questions: 45
Worksheet time: 2hrs 30mins
Represents how goods, services, and money move through our economy.
Circular Flow Diagram
Supply Curve
Demand Curve
Supply and Demand Curve
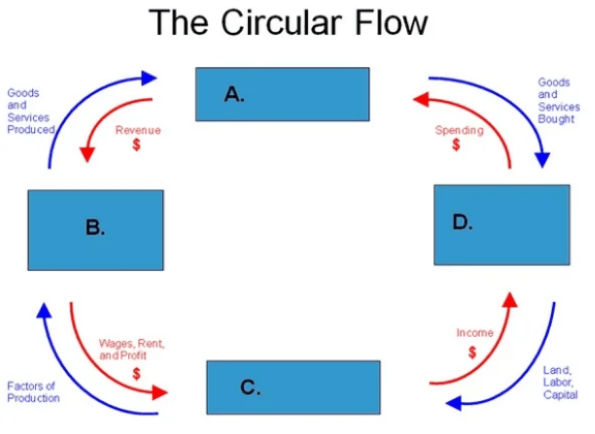
Point B represents
Product Market
Factor Market
Individuals
Businesses
What are the four main parts of the circular flow diagram?
Product Market, Stock Market, Factor Market, Fish Market
Product Market, House Market, Factor Market, Good Market
Factor Market, Product Market, Households, Firms
Factor Market, households, Stock Market, super market
Where are factors of production (land, labor, etc) exchanged in the circular flow model?
Factor Market
Product Market
Firms
Individuals
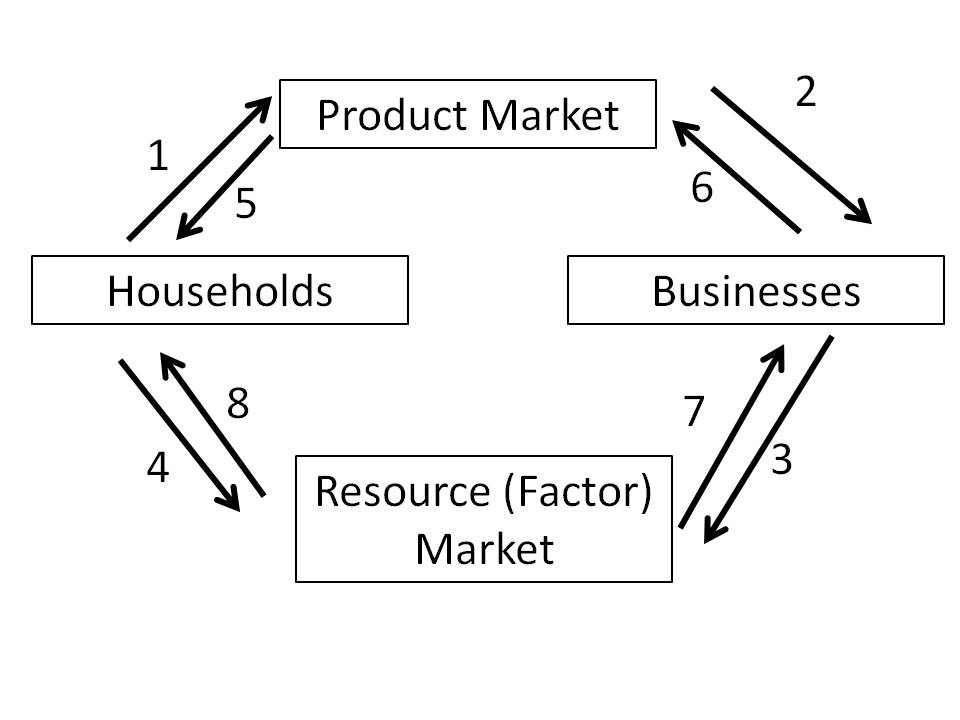
Arrows 4 and 7 on this circular flow diagram demonstrate
expenditures
finished goods and services
factors of production
factor payments


A merger is
Two business agreeing to becoming one new business
One business buying shares in another business
One business taking over control of another business
Two businesses co operating with each other.
A corporation is a business for which ownership is divided into shares or stocks that may be bought and sold through a stock exchange.
True
False
The shareholders may receive a part of the company's annual profit, if there is one, in the form of a dividend.
True
False


What letter on the graph represents the proper location for the market structure “oligopoly”?
W
Y
X
Z

If you were to graph this demand schedule, the demand curve would
Slope upward from left to right
Be horizontal
Slope downward from left to right
Be vertical

Based on this graph, how many Beanie Babies™ were demanded at a price of $6 before they became a fad?
100
200
300
400

The movement in the graph shows that the quantity demanded of butter decreased because the
Price of butter increased
Price of margarine decreased
Price of margarine increased
Price of butter decreased

What does the movement shown on this graph represent?
A change in demand
Inverse
The inverse relationship between price and quantity demanded
Diminishing marginal utility

Study the illustration. At a price of $25, how much more of the product is demanded on curve D'D' than on curve DD?
2 units
3 units
1 unit
4 units

Assume that Damien and Kara are the only two people in the market for mystery novels. Based on the graphs, what would be the market quantity demanded for mystery novels at a price of $5?
a.
5
c.
15
b.
10
d.
20
5
10
15
20

Based on the graph, how does the market demand for concert tickets change if the price increases from $30 to $40?
QD decreased by 4
The demand curve shifts to the left
QD decreases by 4,000
QD increases by 4,000

Based on the table, what is the market demand for burritos at a price of $5?
2
3
6
8

The change from the old demand curve to the new demand curve shown in the table represents a
Movement upward along the demand curve
Movement downward along the demand curve
Shift of the demand curve to the left
Shift of the demand curve to the right
An increase in the price of milk causes a decrease in the demand for cereal. The two products are
Substitute goods
Complement goods
Unrelated goods
Demand Elastic
A demand schedule shows
An upward-sloping curve that illustrates the positive relationship between price and quantity demanded
A listing of the various quantities demanded of a particular product at all prices that might prevail in the market
The fluctuations in demand that occurred over a specified period of time
The fluctuations in demand scheduled to occur over the following year
Which of the following will cause the market supply curve to shift?
A change in the price of the product
A change in the number of consumers
A change in the numbers of sellers offering the product
A change in demand for the product

According to this supply curve, 400 movie videos will be supplied at what price?
$10
$12
$14
$16

According to this supply curve, if the price of movie videos decreases from $18 to $16, the quantity supplied will
Rise from 800 to 1000
Fall from 1000 to 800
Rise from 600 to 800
Fall from 800 to 600
When producers offer fewer products for sale at each and every price,
The supply curve has shifted to the right
The supply curve has shifted to the left
The price per unit decreases
They expect subsidies

What does the movement shown on this graph represent?
A change in supply
A change in quantity supplied
The law of diminishing returns
A shift in the market supply curve

Which of the following choices could cause the movement shown in the graph?
technology improves
production
inputs become cheaper
the number of firms
increases
taxes increase

What does the movement from b to b' on the graph represent?
an increase in quantity supplied
a decrease in quantity supplied
a decrease in supply
an increase in supply

Study the illustration. At a price of $10, how many more units of the product are supplied on curve S'S' than on curve SS?
9
6
3
12

Assume that ABC Corp. and XYZ Corp. are the only two firms that supply soccer balls. Based on the graphs, what would be the market quantity of soccer balls supplied at a price of $20?
3
6
9
10

Based on the graph, how does the market supply of baseball gloves change if the price increases from $25 to $35?
Quantity supplied
decreases by 9,000
Quantity supplied
increases by 9,000
Quantity supplied
decreases by 3,000
Quantity supplied
increases by 3,000
At a given price, a surplus occurs when
the quantity demanded is more than the quantity supplied
the quantity demanded is the same as the quantity supplied
the quantity supplied is less than the quantity demanded
the quantity supplied is greater than the quantity demanded

In the table, market equilibrium will occur at what price?
$20
$16
$14
$10

Suppose the demand curve shifts from D1 to D2, as shown on the graph. How do the quantity supplied and quantity demanded change at the new equilibrium price?
Quantity supplied increases and quantity demanded decreases
Quantity supplied decreases and quantity demanded increases
Both quantity supplied and quantity demanded increase
Both quantity supplied and quantity demanded decrease

On the graph, suppose that demand for gold stands at D1D1. Then the opening of a new gold mine shifts the supply curve from S1S1 to S2S2. How does this shift affect price?
price rises from 280 to 400
price rises from 400 to 850
price declines from 400 to 280
price declines from 850 to 400

