
 Worksheets
Scientific Method
Total questions: 38
Worksheet time: 2hrs 54mins
Scientific methods includes:
only sampling
experiments, and observations
experiments, observations, surveys and sampling
What is an observation?
Something you measure or detect with your senses.
The way you feel about something
An educated guess
A theory that has been disproved
Which of the following is NOT a testable question?
How do rockets work?
Does fertilizer help plants grow bigger?
Does heart rate increase with exercise?
Does the freezing point of water change at different elevations?
Which units are the BASE units in the metric system? Check all that apply.
Meters
Liters
Grams
Inches
Miles
What scientific tool is used to measure volume of liquids, such as water and chemicals?
Meter Stick
Ruler
Graduated Cylinder
Triple Beam Balance
What scientific tool is used to measure the mass of an object like a beaker?
Meter Stick
Ruler
Graduated Cylinder
Triple Beam Balance
Which unit below is the largest?
Kilogram
Gram
Centigrams
Milligrams
Which unit below is the SMALLEST?
Kilometer
Millimeters
Meters
Centimeters

What are observations that are measured or counted called?
qualitative data
quantitative data

What are observations made using our five senses called?
qualitative data
quantitative data
What type of graph would you make to show how many of your classmates were born in each month of the year?
line
bar
circle
scatter plot

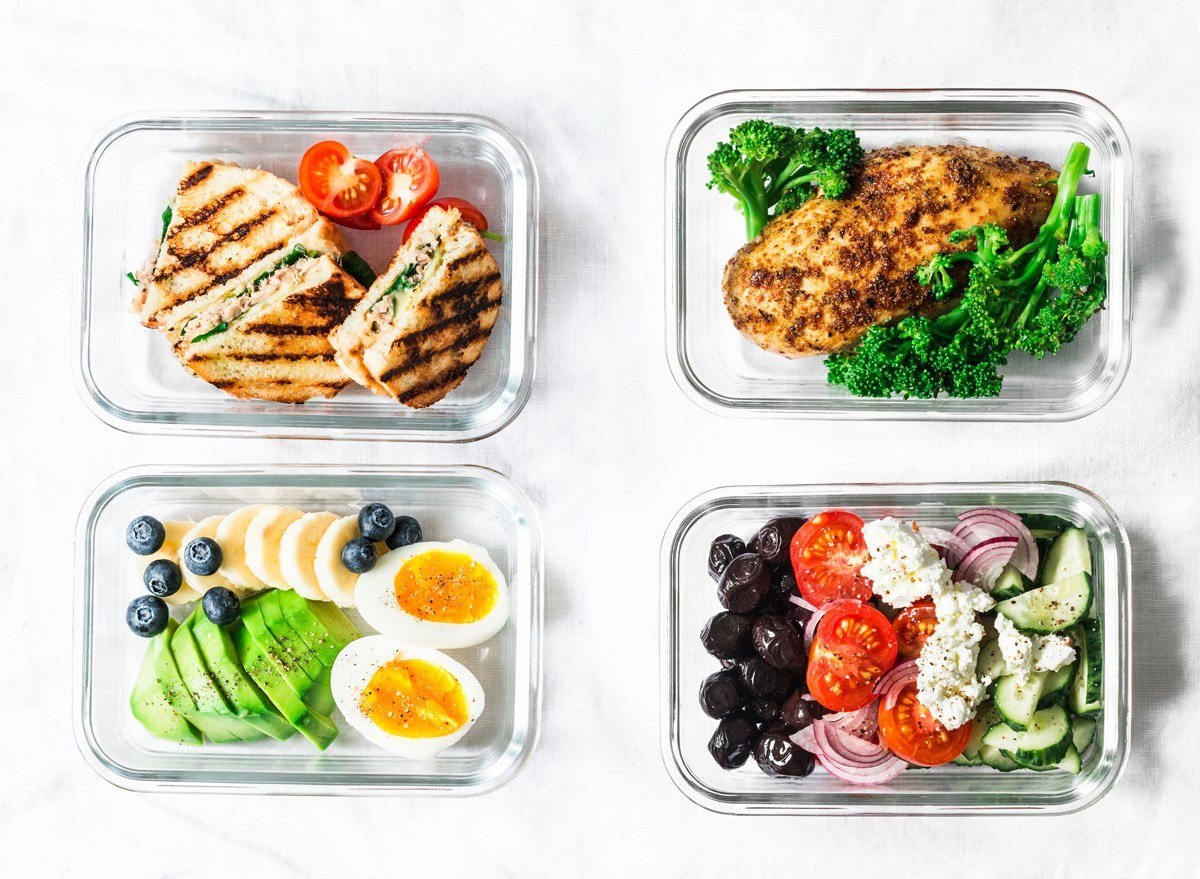
You need to take a survey at school to see which type of lunch food is most preferred by 7th grade students.
Which type of graph would be best to display the data?
Line Graph
Bar Graph or Pie Chart
Scatter Plot
Funnel Chart
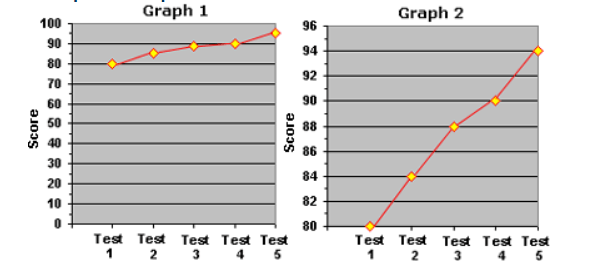
A sneaky student wants to impress his parents by showing them a graph of his performance progress on the last 5 science tests.
Which graph should he use to impress his parents?
Graph 1
Graph 2
Neither
Both
The one factor that a scientist controls during an experiment. This goes on the x-axis.
Independent Variable
Dependent Variable
The variable that is measured. It goes on the y-axis.
Independent Variable
Dependent Variable
When should a bar graph be used?
When comparing parts of a whole
When showing change over time
When comparing data between different groups of categories
Whenever you want
When should a line graph be used?
When comparing parts of a whole
When showing change over time
When comparing data between different groups of categories
Whenever you want
What is the mean?
The average value
The middle item of data when
all the data is arranged in order.
The most common number
The difference between the
highest and lowest values in a set of numbers.
What is the median?
The average value
The middle item of data when
all the data is arranged in order.
The most common number
The difference between the
highest and lowest values in a set of numbers.
What is the mode?
The average value
The middle item of data when
all the data is arranged in order.
The most common number
The difference between the
highest and lowest values in a set of numbers.
What is the range?
The average value
The middle item of data when
all the data is arranged in order.
The most common number
The difference between the
highest and lowest values in a set of numbers.
What is the range of this data?
3,4,3,4,5,2,6,7,3,3
3-7
1-7
1-10
2-7
What is the mode of this data?
3,4,3,4,5,2,6,7,3,3,
3
4
2
5
What is the median of this data?
3,4,3,4,5,2,6,7,3,3
1
2
4
3
What is the mean of these numbers:
3, 5, 7, 9
6
24
4
8

