
 Worksheets
VELOCITY-TIME GRAPH
Total questions: 47
Worksheet time: 28mins

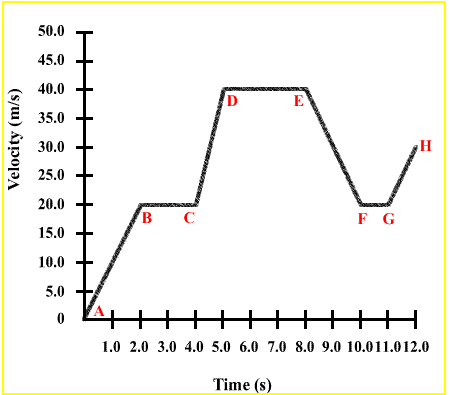
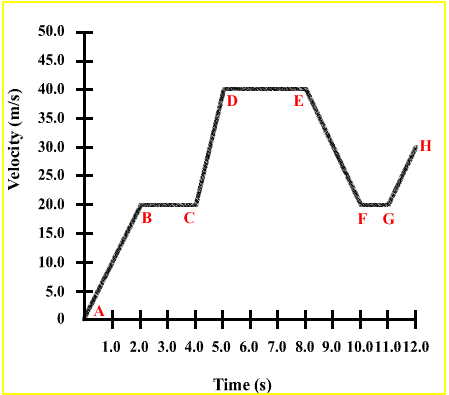
Select the description of motion from A - B.
Slowing down away from the origin
Speeding up away from the origin
Constant velocity away from the origin
Constant velocity towards the origin

What segment of the graph shows no motion, or standing still?
A - B
B - C
C - D
None

Describe the motion from B - C.
Standing still
Constant velocity of 60 m/min
Constant velocity of 0 m/min
Accelerating
What does a horizontal line (not on the x-axis) mean on a V-T graph?
No movement
Constant velocity
Changing velocity
Change in direction

Part A of the graph is from 0s to 25s. Which of these statements is true about Part A?
The object is at rest.
The object is accelerating (its velocity is increasing)
The object is decelerating (its velocity is decreasing)
The object is moving at a constant velocity.
Part B of the graph is from 25s to 35s. Which of these statements is true about Part B?
The object is at rest.
The object is accelerating (its velocity is increasing)
The object is decelerating (its velocity is decreasing)
The object is moving at a constant velocity.
Part C of the graph is from 35s to 55s. Which of these statements is true about Part C?
The object is at rest.
The object is accelerating (its velocity is increasing)
The object is decelerating (its velocity is decreasing)
The object is moving at a constant velocity.
What does a flat (horizontal) line on a velocity-time graph mean?
[Example section B on this graph]
The object is not moving.
The object is moving, but at a constant velocity.
The object is accelerating, and its acceleration is positive.
The object is accelerating, and its acceleration is negative.
You can calculate the slope of a velocity-time graph.
If you calculate the slope of the graph between two points, what would that tell you?
The velocity of the object.
The distance travelled by the object.
The acceleration of the object.
The mass of the object
During section A of the graph (between 0s and 25s), the object is accelerating.
Change in velocity in this time = 3 - 0 = 3m/s
Time taken = 25 - 0 = 25s
What is its acceleration?
Acceleration = Change in velocity x time = 3 x 25 = 75m/s2
Acceleration = Change in velocity / time = 3/25 = 0.12m/s2
The gradient of a velocity-time graph represents (a) .
The area under a velocity-time graph represents (a) .
A flat section of a velocity-time graph represents (a) .

Describe the motion in section D.
(a)
A curve on a velocity-time graph shows that the acceleration is (a) .

Which section represents a steady speed?
A
B
C
D

Calculate the acceleration in section A
(a)

Calculate the acceleration in section C.
(a)

State the size of the acceleration in section B.
(a)

Calculate the distance travelled in section B.
(a)

Calculate the distance travelled in section D
(a)

Calculate the distance travelled in section C.
(a)




What is the unit for acceleration?
m
s
m/s
m/s/s
What is the unit for displacement?
m
s
m/s
m/s/s
What is the unit for velocity?
m
s
m/s
m/s/s
The slope of a velocity - time graph represents?
Velocity
Displacement
Acceleration
Time
The area between the x-axis and the line of a velocity - time graph represents?
Velocity
Displacement
Acceleration
Time
The x-axis of a velocity - time graph represents?
Velocity
Displacement
Acceleration
Time
The y-axis of a velocity - time graph represents?
Velocity
Displacement
Acceleration
Time

The graph depicts what type of motion?
Rest
Constant Velocity
Speeding up
Slowing down

The graph depicts what type of motion?
Rest
Constant Velocity
Speeding up
Slowing down
Which direction is the object moving based on the graph
positive
negative

Which section of this velocity-time graph shows the man not moving?
Section A
Section B
Section C
None of the sections

Which line shows the fastest velocity? (choose all that apply)
Line A
Line B
Line C
Line D
None of them
Which line does not show a constant velocity? (choose all that apply)
Line A
Line B
Line C
Line D
None of them

