
 Worksheets
Statistics Review A: Descrip Stat, Test Design, Lin Reg
Total questions: 95
Worksheet time: 3hrs 10mins

A (a) is a collection of persons, things, or
objects under study

A (a) is collected to study a population.

(a) is done to the larger population to study that portion (the sample) to gain information about the population.

A (a) is a number that represents a property of the sample.

A (a) is a numerical characteristic of the whole population that can be estimated by a
statistic.

The sample must contain the characteristics of the population in order to be a (a) sample.

A (a) , usually notated by capital letters such as X and Y, is a characteristic or measurement that can be determined for each member of a population.

(a) variables take on values with equal units such as weight in pounds and time in hours.

(a) variables place the person or thing into a category.

(a) are the actual values of the variable. They may be numbers or they may be words.

(a) is a single value of a variable.

If you were to take three exams in your math classes
, you would calculate your (a) score by adding the three exam scores and dividing by three.

If, in your math class, there are 40 students and 22 are men
, then the (a) of men students is 22/40 .
A study was conducted at a local college to analyze the average cumulative GPA’s of students who graduated last
year. Fill in the letter of the phrase that best describes each of the items below. The population is ...
all students who attended the college last year
the cumulative GPA of one student who graduated from the college last year
all students who graduated from the college last year
a group of students who graduated from the college last year, randomly selected
the average cumulative GPA of students who graduated from the college last year
A study was conducted at a local college to analyze the average cumulative GPA’s of students who graduated last
year. Fill in the letter of the phrase that best describes each of the items below. The statistic is ...
all students who attended the college last year
the cumulative GPA of one student who graduated from the college last year
the average cumulative GPA of students in the study who graduated from the college last year.
a group of students who graduated from the college last year, randomly selected
the average cumulative GPA of students who graduated from the college last year
A study was conducted at a local college to analyze the average cumulative GPA’s of students who graduated last
year. Fill in the letter of the phrase that best describes each of the items below. The parameter is ...
all students who attended the college last year
the cumulative GPA of one student who graduated from the college last year
all students who graduated from the college last year
a group of students who graduated from the college last year, randomly selected
the average cumulative GPA of students who graduated from the college last year
A study was conducted at a local college to analyze the average cumulative GPA’s of students who graduated last
year. Fill in the letter of the phrase that best describes each of the items below. A sample is ...
all students who attended the college last year
the cumulative GPA of one student who graduated from the college last year
all students who graduated from the college last year
a group of students who graduated from the college last year, randomly selected
the average cumulative GPA of students who graduated from the college last year
A study was conducted at a local college to analyze the average cumulative GPA’s of students who graduated last
year. Fill in the letter of the phrase that best describes each of the items below. The variable is ...
all students who attended the college last year
the cumulative GPA of one student who graduated from the college last year
all students who graduated from the college last year
a group of students who graduated from the college last year, randomly selected
the average cumulative GPA of students who graduated from the college last year
A study was conducted at a local college to analyze the average cumulative GPA’s of students who graduated last
year. Fill in the letter of the phrase that best describes each of the items below. The variable is ...
all students who attended the college last year
the cumulative GPA of one student who graduated from the college last year
all students who graduated from the college last year
a group of students who graduated from the college last year, randomly selected
the average cumulative GPA of students who graduated from the college last year
Sporting Illustrated collects data on its readers by asking them to fill out and send in a survey from the June issue.
Convenience
Systematic
Stratified
Simple Random
A group of lobbyists has a list of 100 senators. They decide to talk to every 7th senator on the list about their position on farm subsidies.
Convenience
Systematic
Stratified
Simple Random
A teacher puts all her students' names in hat, then selects 3 names from the hat. These students will take a standardized test.
Convenience
Systematic
Stratified
Simple Random
The president of a college randomly selects 2 students from each department to serve on a student advisory board.
Convenience
Systematic
Stratified
Simple Random
Political webpages often allow readers to rate (if they want to) whether they strongly agree, agree, disagree, or strongly disagree with the President's decision on any given situation. This is a form of:
Self-Selected
Convenience Sampling
Simple Random Sampling
Systematic Random Sampling
A teacher wants to know the average time spent doing homework by the students in her class of 20 girls and 5 boys.
She selects the five closest to her desk.
simple random
Self Selected.
Convenience
Systematic Random
A teacher wants to know the average time spent doing homework by the students in her class of 20 girls and 5 boys.
She picks the student in every 5th seat.
Simple Random
Systematic
voluntary response
convenience
A teacher hands out an index card and asks ALL of her students to write down the following information: age, height (in inches), and what grade they are in.
Which of the following best describes her method of data collection?
Census
Simple Random Sample
Cluster Random Sample
Stratified Random Sample
An independent research company wants to go door to door to survey people in the city of Fontana. The company decides to number all blocks within the city limit, randomly choose 1 block and survey all households on that block.
This is an example of:
Simple Random Sample
Stratified Random Sample
Cluster Random Sample
Systematic Random Sampling
State the type of sample.
In order to determine the average IQ of ninth-grade students, a school psychologist obtains a list of all schools in the local public school system. She randomly selects five of these schools and administers an IQ test to all ninth-grade students at the selected schools.
Stratified Random Sample
Cluster Sample
SRS
Random Sample
A political polling group is interested in learning about the proportion of registered voters who favor a particular candidate for mayor. Which of the following sampling plans may have introduced bias?
Individuals were selected randomly to participate from a list of registered voters.
Every 50th person on a list of registered voters was contacted and asked to identify who they would vote for in the upcoming election.
A list of registered voters was first separated into two lists—one of males and one of females. Then individuals were selected at random from each of the two lists.
A survey was mailed to all registered voters and those who returned the survey make up the sample
None of the above sampling plans creates the potential for bias.
Which of the following doesn’t result in some form of bias?
Choosing AP students to survey regarding their GPA in order to estimate the average GPA in a school.
Polling a group of potential voters outside a Republican campaign office in order to estimate the proportion of city residents who favor a particular candidate.
Surveying people who work in the marketing department of a large corporation in order to assess employee satisfaction with management policies.
Choosing a stratified random sample of juniors and seniors at a high school in order to estimate the proportion of juniors and seniors who plan to go on to college.
Asking shoppers leaving a grocery store if they think groceries should cost less in order to estimate the proportion of city residents who think groceries cost too much.






How many students sent between 10 and 19 text?
25
22
15
45


What is the shape of this bar graph?
Skew right
Skew left
Symmetrical
uniform


skewed left
skewed right
symmetrical


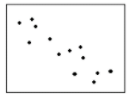

Estimate the correlation coefficient for this scatterplot.
A) r = 1.2
B) r = 0.89
C)r = 0
D) r = -0.89
What would be an appropriate correlation (r) relating the number of kids you have and the number of points the Vikings score in a game?
r = 1
r = 0.43
r = 0
r = - 0.35
r = -1
A correlation value (r) that has a strong, positive linear association would have a value close to
1
0
-1
Cannot be answered

The scatter plot below shows the number of books read by students in Mrs. Hall’s English class and their final grades. Which statement represents the best description about the line of best fit?
A) The more books students read, the lower their English grade.
B) The more books students read, the higher their English grade.
C) The fewer books students read, the higher their English grade.
D) No relationship exists between the number of books students read and their English grades.
As x increases, y increases
A) correlation coefficient
B) causation
C) positive correlation
D) negative correlation
As x increases, y decreases.
A) no correlation
B) negative correlation
C) correlation coefficient
D) positive correlation


The scatter plot shows the number coffee shops in different cities and the number of violent crimes. Which of the following is NOT true?
A) As the number of coffee shops increase, violent crimes appears to increase.
B) The line of best fit (regression line) shows a positive correlation
C) The data has a positive correlation coefficient
D) An increase in coffee shops causes an increase in violent crimes



