
 Worksheets
Kelp CSA 1 Review Quiz
Total questions: 37
Worksheet time: 37mins


In the food web above, what eats the rabbit?
Fox
Hawk
Vole
Grass

In the energy pyramid, what is the bottom level composed of?
Producers
First-Level Consumers
Second-Level Consumers
Third-Level Consumers


If only 10% of the energy in the pyramid is available as you move from one trophic level to the next, what happens to the other 90%?
Passed on to decomposers
Metabolized and "lost" as heat energy and waste
Assembled into tissues of producers permanently
False statement - 100% of the energy is available

If the average Bluefin Tun weighs 20 pounds, how many pounds of secondary consumers are needed in the third trophic level to support it?
20 pounds
200 pounds
2,000 pounds
20,000 pounds

The largest number of individuals that an environment can support long term is...
carrying capacity
emigration
immigration
population density
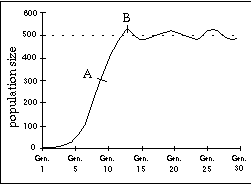
What is the carrying capacity of the graph?
around 500
more than 800
less than 300
around 700
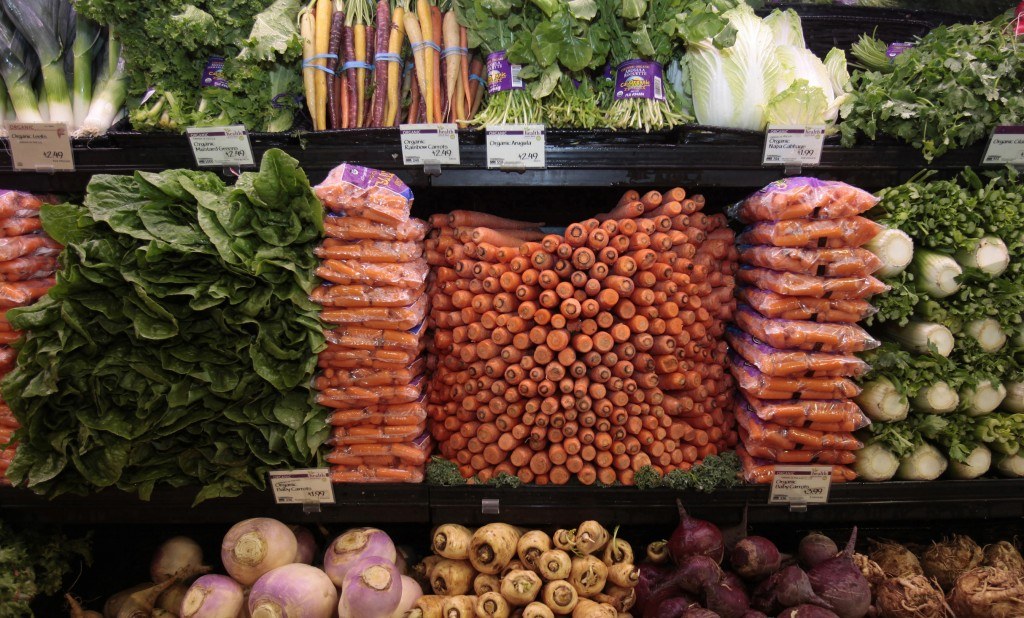
What are factors that affect carrying capacity?
Biotic only
Biotic and abiotic
Depends on the ecosystem
Abiotic only
A scientist was studying a population of fish in a pond over a period of 10 years. He observed that the population increased each year for 3 years, and then remained nearly constant for the rest of the study. The best explanation for this observation is that the population had
stopped reproducing
reached carrying capacity
mutated into a different species
run out of food and all died
Which of the following is a biotic factor that would affect the carrying capacity of a population?
Soil
Predator
Rainfall
Sunlight

Which statement best describes the predator-prey relationship displayed on this graph?
There is no relationship between the predator and prey.
When the prey population increases, the predator population decreases.
When the prey population increases, the predator population increases.
when the predator population increases, the prey population increases.

If the carrying capacity of a predator decreases, what will happen to the carrying capacity of the prey?
Will Increase
Will Decrease
Will stay the same

The graph to the right shows the interaction of the wolf and moose populations on Isle Pekie. If the moose population continues to increase, the wolves' food supply will increase. What will most likely happen to the wolf population as a result?
It will decrease.
It will increase.
It will remain the same.

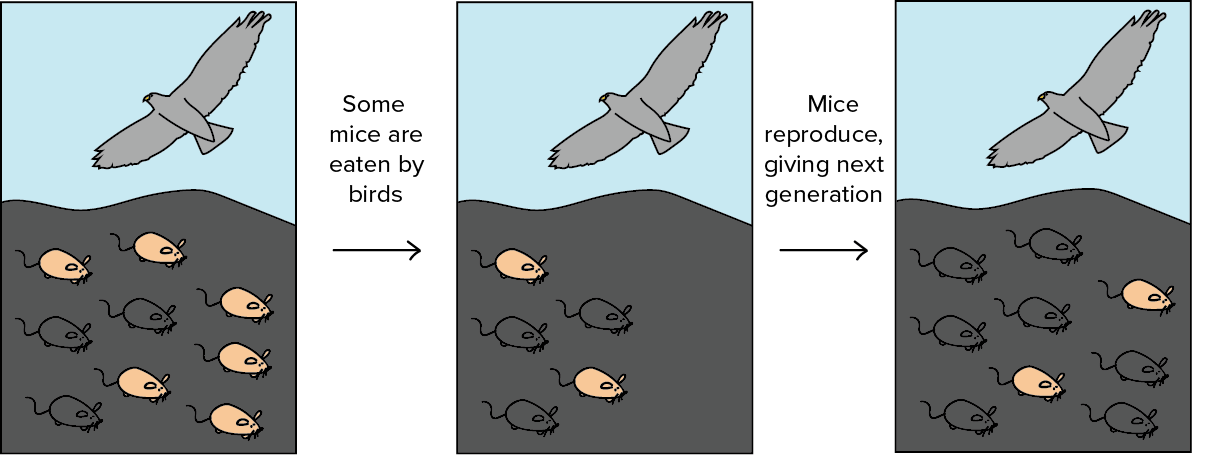
Due to pollution, a pond becomes darker over time. Which trait variation became more common?
light fish
dark fish
What word describes a trait that helps an organism survive in its environment?
natural selection
mutation
camouflage
adaptation

What is a keystone species?
A species that helps to hold an ecosystem together
A species that lives in or around rocks
Keys and stones have nothing to do with ecology
A keystone isn't a living thing, it's just a stone
As you work your way up the energy pyramid, what happens to the energy?
It increases
It decreases
It stays the same
Nothing
Organisms that break down wastes and dead organisms and return the raw materials to the environment
Producer
Consumer
Decomposer
Food chains show energy transfer between organisms. The size of a food chain can vary, yet there is a limit to the number of levels that a food chain can reach. Why is there a limit to the number of levels that a food chain can reach?
Plants are not infinitely in the world
Producers can only eat what is available
Carnivores are too big to be eaten
Energy is lost when you move up a trophic level

What would happen to the organisms in the food web below if the number of phytoplankton and vegetation decreased?
Only the small fish would be affected
Only the osprey would be affected
The small fish and wading birds would be affected
The entire food web would be affected

What would happen to this food chain if we doubled the population of the rabbits?
The populations of the snakes and hawks would also increase.
The populations of the grass, snakes, and hawks would decrease.
The grass population would decrease. The snake and hawk population would increase.
The grass and hawk population would decrease. The snake population would increase.

Which most likely caused the rabbit population (light green line) to decrease over the first time unit (0 to 1) in the graph?
A disease in the rabbit population
A decrease in the amount of grass available
A decreasing population of hawks
A higher population of snakes than normal

If a disease were to affect the snakes in the food chain, what will be the initial (beginning) effect on the populations of hawks and rabbits?
The populations of hawks and rabbits will decrease.
The populations of hawks and rabbits will increase.
The population of hawks will increase. The population of rabbits will decrease.
The population of hawks will decrease. The population of rabbits will increase.
Humans use calories they obtain from ____ as their energy source.
food
water
sunlight
minerals

