
 Worksheets
Carrying Capacity and Population Overshoot
Total questions: 20
Worksheet time: 14mins

What is the carrying capacity of the idealized population graph?
1000
8000
800
600
This may cause a population to increase
increase of food supply
removal of predators
removal of disease
all of these


If the carrying capacity of a predator decreases, what will happen to the carrying capacity of the prey?
Will Increase
Will Decrease
Will stay the same
What are factors that affect carrying capacity?
Biotic only
Biotic and abiotic
Depends on the ecosystem
Abiotic only
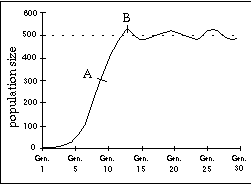
'B' represents...
overshoot of the carrying capacity
logarithmic growth
exponential growth
lag phase
What is the carrying capacity of the graph?
around 500
more than 800
less than 300
around 700
When death rate is equal to birth rate...
population increases
population decreases
population stays the same.
population rapidly increases then becomes stable
When birth rate is high and death rate is low...
population increases
population decreases
population stays the same
all of these
All the biotic and abiotic factors and the interactions among them in a given area
Interdependent Relationship
Carrying Capacity
Ecosystem
Competition

What type of growth is demonstrated in the graph?
Exponential
Carrying capacity
Linear
Negative
Which of the following demonstrates population growth when there is limited available water in an area?


If there are 25 rabbits living in a 5 acre area, what is the population density of the rabbits?
125 rabbits per acre
30 rabbits per acre
20 rabbits per acre
5 rabbits per acre

What does the straight yellow line represent? What is it called?
exponential growth, E line
fluctuation, K line
carrying capacity, K line
environment resistance, R line

What happens if a population grows past its carrying capacity?
The population keeps growing
The population starts to die off
The entire species will go extinct
The carrying capacity just increases

The largest number of individuals that an environment can support long term is...
carrying capacity
emigration
immigration
population density

Something that regulates the size of a population is called...
a limiting measure
a limiting factor
carrying capacity
biodiversity
When the death rate rises and the birth rate lowers...
population increases
population decreases
population stays the same
all of these
A scientist was studying a population of fish in a pond over a period of 10 years. He observed that
the population increased each year for 3 years, and then remained nearly constant for the rest of
the study. The best explanation for this observation is that the population had
stopped reproducing
reached carrying capacity
mutated into a different species
run out of food and all died

