Wayground logo

Free Printable Worksheets

Font size

S
M
L
XL
Worksheets

Motion Review 2022

Total questions: 37

Worksheet time: 29mins

Name
Class
Date
1.
In 2015, Shea-Z ran 1600 m in 9 minutes, in 2017 his speed was 160 m/min.  In which year was Shea-Z's speed best?
a)
2017, because he ran it in less time
b)
2015, because his speed was 178 m/min
c)
2017, because his speed was 160 m/min
d)
Neither, his speed was the same both years
2.
The baseball park is 4200 m from Camden's house.  I took him 30 minutes to get there.  What was Camden's speed?
a)
.007 m/min
b)
12.60 m/min
c)
140 m/min
d)
126 m/min
3.
A jet airliner flies 4100 km from New York City to San Francisco in 4.25 hours.  What is its average speed?
a)
964.71 km/hr
b)
96.47 km/hr
c)
17,425 km/hr
d)
174.25 km/hr
4.
If, on a hike, Nathaniel traveled 2,800 m in 2 hours, what was his average speed in m/hr?
a)
5,600 m/hr
b)
140 m/hr
c)
56 m/hr
d)
1,400 m/hr
5.
Akela rode her bike 48 km for 3 hours, she rested for 1/2 an hour and then rode another 24 km for 1 hours. What was the total time she spend on her bike ride? (Remember, stops count!)
a)
24 hours
b)
48 hours
c)
4 hours
d)
4.5 hours
6.
Akela rode her bike 48 km for 3 hours, she rested for 1/2 an hour and then rode another 24 km for 1 hours. What was the total distance she rode on her bike?
a)
24 km
b)
72 km
c)
48 km
d)
76 km
7.
Using the graph provided, how long did it a ball to roll 30 cm?  What was the average speed of the ball?
a)
35 seconds, 1.17 cm/s
b)
30 seconds, 1 cm/s
c)
30 seconds, 1.17 cm/s
d)
35 seconds, 1 cm/s
8.
Location for comparison.
a)
Position
b)
Location
c)
Reference Point
d)
Direction
9.
Change in position over time.
a)
Location
b)
Velocity
c)
Motion
d)
Movement
10.
Distance over time.
a)
Travel
b)
Motion
c)
Velocity
d)
Speed
11.
Speed plus direction.
a)
Velocity
b)
Motion
c)
Position
d)
Acceleration
12.
Average speed over time.
a)
Total Speed
b)
Average Speed
c)
Velocity
d)
Reference Point
13.
How is speed calculated?
a)
S= D/M
b)
S= D/T
c)
S= T/D
d)
T= S/D
14.
What does this graph represent?
a)
Constant Speed
b)
Acceleration
c)
Deacceleration
d)
Not moving
15.
Which runner won the race?
a)
A
b)
B
c)
C
d)
It was a tie
16.
Which runner had a head start?
a)
A
b)
B
c)
C
d)
None of them
17.
According to the graph how far does the person travel in the first 5 seconds?
a)
2 m
b)
10 m
c)
0 m
d)
5 m
18.
What is happening at A?
a)
Stationary
b)
Accelerating
c)
Slower steady speed; moving away from the starting position
d)
Steady speed; returning to start position
19.
What is happening at E?
a)
Stationary
b)
Accelerating
c)
Fast steady speed; moving away from the starting position
d)
Steady speed; returning to start position
20.

A runner races in the 100 meter dash. It takes her 10 seconds to finish. What is her average speed?

a)

10 m/s

b)

1000 m/s

c)

100 seconds

d)

10 seconds

21.
Which runner won the race?
a)
Albert
b)
Bob
c)
Charlie
22.
How long did one of the runner's rest?
a)
8 seconds
b)
13 seconds
c)
5 seconds
d)
50 seconds
23.
Velocity is
a)
speed and acceleration
b)
constant speed
c)
a frame of reference
d)
speed in a given direction
24.
A car driving at 50 miles per hour drives for 2 hours. What distance did it cover?
a)
50 miles
b)
25 miles
c)
100 miles
d)
75 miles
25.
What does this graph represent?
a)
Constant speed
b)
Acceleration
c)
Not moving
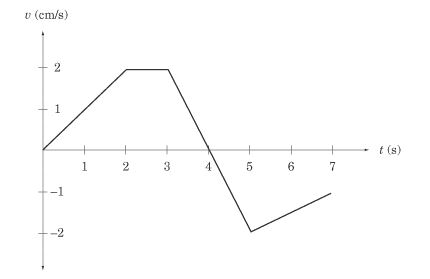
26.

What is happening between 2 and 3 seconds?

a)

The object is not moving.

b)

The object is not accelerating.

c)

The object is slowing down.

d)

The object is speeding up.

27.

What is happening between 3 seconds and 4 seconds?

a)

The object is moving in a negative direction.

b)

The object is returning to its starting position.

c)

The object is slowing to a stop.

d)

The object is changing direction.

28.
A push or a pull is best defined as which of the following? 
a)
Force
b)
Gravity
c)
Newton
d)
Friction 
29.

The direction of the force of friction is always _____ the direction of motion

a)

similar to

b)

opposite

c)

unchanged in

d)

the same as

30.

How many types of friction are there?

a)

1

b)

2

c)

3

d)

4

e)

5

31.

Which best describes the factor(s) that contribute to the amount of friction that is produced?

a)

Distance and Mass

b)

Mass and Surface Type

c)

Surface Type and Distance

d)

Mass and Weight

32.

Which type of friction is shown in the picture?

a)

fluid

b)

static

c)

rolling

d)

sliding

33.

Which type of friction is shown in the picture?

a)

rolling

b)

static

c)

fluid

d)

sliding

34.

This photo represents...

a)

Fluid Friction

b)

Sliding Friction

c)

Static Friction

d)

Rolling Friction

35.

Kid B is experiencing what type of friction?

a)

Static

b)

Fluid

c)

Rolling

d)

Sliding

36.
What type of friction is shown in this picture?
a)
Fluid
b)
Sliding
c)
Rolling
d)
Static
37.
What type of friction is shown in this picture? 
a)
Sliding 
b)
Static
c)
Fluid
d)
Rolling