
 Worksheets
Average Speed and Graphs
Total questions: 20
Worksheet time: 39mins
Name
Class
Date
1.

What is speed?
a)
how far you go
b)
how much distance is covered over a period of time
c)
how fast you accelerate
d)
the change in the location of a object
2.
What is the equation to calculate speed?
a)
speed = distance/time
b)
speed = time/distance
c)
speed = time x distance
d)
speed = speed/time
3.

A runner races in the 100 meter dash (distance). It takes her 10 seconds to finish (time). What is her average speed?
a)
10 m/s
b)
1000 m/s
c)
100 seconds
d)
10 seconds
4.

What is the speed of an object that travels 60 meters in 4 seconds?
a)
240 m/s
b)
15 m/s
c)
0.067 m/s
d)
15 mph
5.

Find speed when distance is 142 km and time is 2 hours.
a)
71km/hr
b)
52km/hr
c)
17km/hr
d)
90km/hr
6.

How far will a person go if they jog for 2 hours at a speed of 12 km/hr?
a)
6 km
b)
0.5 km
c)
10 km
d)
24 km
7.

Alan travels 100 km in 5hrs. Find his average speed in km/h
a)
5km/hr
b)
10km/hr
c)
50km/hr
d)
20km/hr
8.

What is the speed of an object that travels 60 meters in 4 seconds?
a)
240 m/s
b)
15 m/s
c)
0.067 m/s
d)
15 mph
9.

What is the speed this motion?
a)
constant speed
b)
not moving
c)
speed increasing
d)
speed increasing at a constant rate
10.

What happened during A to B point?
a)
not moving
b)
increasing speed at a constant rate
c)
moving at a constant speed
d)
moving at 10 m/s2 acceleration
11.

What happened during C to D point?
a)
not moving
b)
increasing speed at a constant rate
c)
moving at a constant speed
d)
decreasing speed
12.

Which runner went the fastest?
a)
A
b)
B
c)
C
13.

Which runner had a head start?
a)
A
b)
B
c)
C
14.
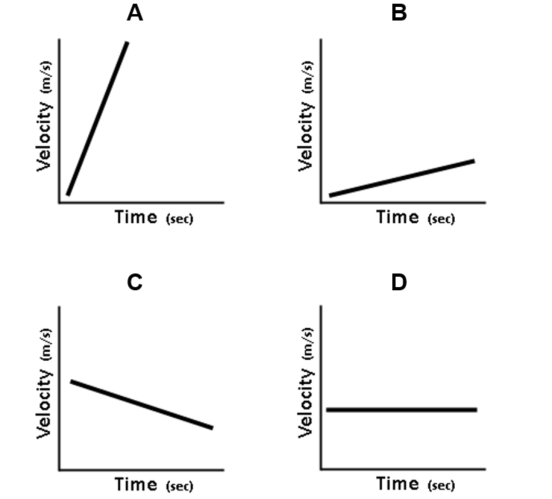
Which graph represents the greatest acceleration?
a)
A
b)
B
c)
C
d)
D
15.

The graph shows the distance a toy car travelled over time. What was the average speed of the toy car represented in the graph?
a)
125 km/min
b)
12.5 km/min
c)
0.1 km/min
d)
0.05 km/min
16.

The motion of a ball is shown in the graph. Calculate the average speed of the ball represented in the graph.
a)
0.2 m/s
b)
0.1 m/s
c)
0.5 m/s
d)
5.0 m/s
17.
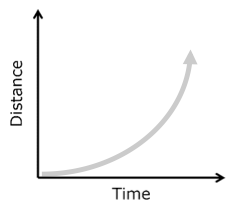
This graph demonstrates an object that is -
a)
Increasing speed
b)
At a constant speed
c)
Slowing down
d)
Stationary
18.

This graph demonstrates an object that is -
a)
Increasing speed away from the start
b)
Moving forward at a constant speed
c)
Decreasing speed toward the start
d)
Moving toward the start at a constant speed
19.

Which line represents an object moving at a faster speed?
a)
A
b)
B
20.

This graph demonstrates an object that is -
a)
At a constant speed
b)
Increasing speed
c)
Decreasing speed
d)
Stationary
100 %

