wayground logo

Free Printable Worksheets

Font size

S
M
L
XL
Worksheets

Topic 3 Review (8CC enVision)

Total questions: 121

Worksheet time: 30hrs 15mins

Name
Class
Date
1.
Is this mapping a function or not a function? 
a)
Function
b)
Not a Function 
2.
Is the relation a function? 
{(4,5), (4,-7), (4,2), (4,0), (4,9)}
a)
Yes
b)
No
3.
Is this table a function or not a function? 
a)
Function
b)
Not a Function
4.
Is this a function? Explain.
a)
Yes; it passes the horizontal line test.
b)
No; it is not a straight line.
c)
Yes; it passes the vertical line test.
d)
No; there is a line connecting the dots.
5.
Is the relation a function? Why.
a)
Yes, because the x-value 11 has two y-values pair with it.
b)
Yes, because each x-value has only one y-value paired with it.
c)
No, because the x-value 11 has two y-values pair with it.
d)
No, because each x-value has only one y-value paired with it.
6.

Is this a function or not?

a)

Function

b)

Not a Function

7.
Which graph does NOT pass the vertical line test?
a)
Graph 1
b)
Graph 2
c)
Graph 3
d)
Graph 4
8.

Is this a function?

a)

Yes

b)

No

c)

Let me ask my dog...

d)

Why are there letters in math?

9.

Is this a function?

a)

Yes

b)

No

c)

I'm Confused

d)

May I phone a friend?

10.
Which set of values is a function?
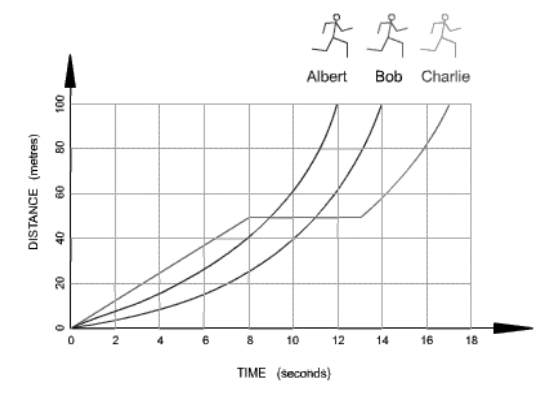
a)
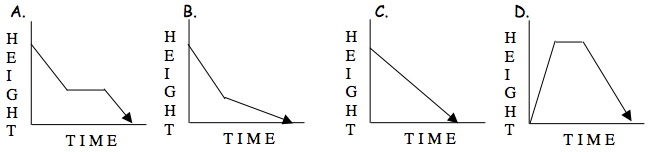
(9,5) (10,5) (9,-5) (10,-5)
b)
(3,4) (4,-3) (7,4) (3, 8)
c)
(6,-5) (7, -3) (8, -1) (9, 1)
d)
(2, -2) (5, 9) (5, -7) (1, 4)
11.

Which set of values is not a function?

a)

(9,5) (10,5) (4,-5) (8,-5)

b)

(3,4) (4,-3) (7,4) (3, 8)

c)

(6,-5) (7, -3) (8, -1) (9, 1)

d)

(2, -2) (5, 9) (-5, -7) (1, 4)

12.
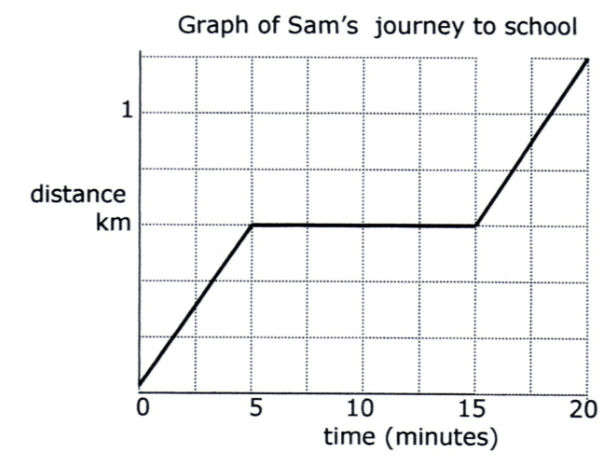
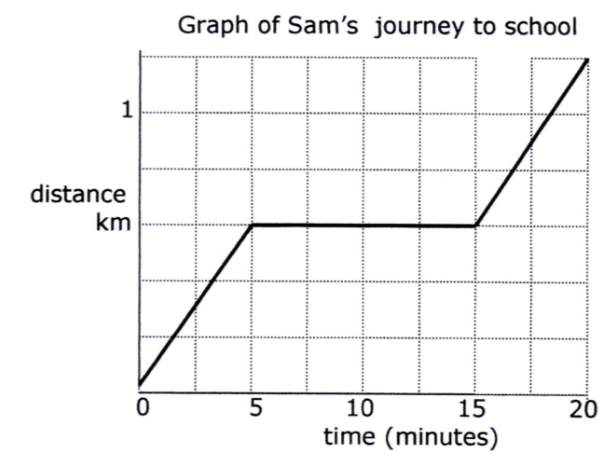
Is this set of ordered pairs a function or not a function? 
a)
Function
b)
Not a Function 
13.
Choose the best answer that describes the image.
a)
Function
b)
Relation
c)
Function and Relation
d)
Neither a relation nor a function
14.
Choose the best answer that describes the image.
a)
Function
b)
Relation
c)
Function and Relation
d)
Neither a relation nor a function
15.
Choose the best answer that describes the image.
a)
Function
b)
Relation
c)
Function and Relation
d)
Neither a relation nor a function
16.
Choose the best answer that describes the image.
a)
Function
b)
Relation
c)
Function and Relation
d)
Neither a relation nor a function
17.
Choose the best answer that describes the image.
a)
Function
b)
Relation
c)
Function and Relation
d)
Neither a relation nor a function
18.
Choose the best answer that describes the image.
a)
Function
b)
Relation
c)
Function and Relation
d)
Neither a relation nor a function
19.
Choose the best answer that describes the image.
a)
Function
b)
Relation
c)
Function and Relation
d)
Neither a relation nor a function
20.
Choose the best answer that describes the image.
a)
Function
b)
Relation
c)
Function and Relation
d)
Neither a relation nor a function
21.
Choose the best answer that describes the image.
a)
Function
b)
Relation
c)
Function and Relation
d)
Neither a relation nor a function
22.
Choose the best answer that describes the image.
a)
Function
b)
Relation
c)
Function and Relation
d)
Neither a relation nor a function
23.
Is this graph a function or not a function? 
a)
Function
b)
Not a Function
24.
What is a set of ordered pairs?
a)
relation
b)
volume
c)
translation
d)
pythagorean theorem
25.
A relation is a function when.......
a)
the input is only with one output.
b)
the input is repeating with different output.
c)
the output is repeating.
d)
the input is repeating.
26.
Which of these tables represent a function?
a)
A
b)
B
c)
C
d)
D
27.
Is everything a relation?! Please don't get this one wrong.
a)
YES!!!!!!!!!!!!!!
b)
no
28.

Write the linear equation in y = mx + b form using the given points.

a)

y = -2x + 1

b)

y = -3x + 1

c)

y = 2x + 1

d)

y = 3x - 1

29.

Write the linear equation in y = mx + b form using the given points.

a)

y = -2x + 1

b)

y = 1/2x - 2

c)

y = 2x - 1

d)

y = -1/2x + 2

30.
Write an equation in slope-intercept form from the points (0, 3) and (-4, -1)
a)
y = x + 3
b)
y =  x - 3
c)
y = x + 1
d)
y = 3x + 1
31.

What is the equation of the line that goes through the points (2, 9) and (3, 1) ?

a)

y= 8x - 5

b)

y= -8x + 25

c)

y= (1/8)x - 2

d)

y= (-1/8)x + 1

32.

Which of the following is the equation of the line that has a slope of 3 and passes through the point (-1, 9)?

a)

y = -3x + 12

b)

y = 3x + 3

c)

y = 3x + 12

d)

y = 3x - 3

33.

Which equation has a line that would pass through both (8, 5) and (9, −1) ?

a)

y = 6x + 53

b)

y = −6x - 53

c)

y = (−4/5)x + 53

d)

y = −6x + 53

34.

Which of the equations below would have a line that passes through both (1, 7) and (0, −9)?

a)

y = 1/2x − 9

b)

y = 16x − 9

c)

y = -1/2x − 9

d)

y = =16x − 9

35.
Write the equation of the line that passes through the points
(3, 3) and (4, -1).
a)
y = -4x - 15
b)
y = 1/4x + 15
c)
y = -4x + 15
d)
y = -1/4x - 15
36.
Write equation of the line containing (6,3) and (4,1)
a)
y = -1x + 5
b)
y = 1x - 3
c)
y = 1x + 5
d)
y = -1x + 3
37.
Find the equation of the line that passes through the points:
(0, -2) and (-5, 3)
a)
y = -x - 2
b)
y = x - 2
c)
y = x + 3
d)
y = -x - 3
38.

Write an equation of a line with the given slope m and y-intercept b: m = –5, b = –6

a)

y = 5x - 6

b)

y = -5x + 6

c)

y = -6x - 5

d)

y = -5x - 6

39.

Which value is the slope in the equation:

y= 4x + 2

a)

4

b)

2

c)

x

40.

Which value is the y-intercept in the equation:

y= 2x -2

a)

2

b)

-2

c)

1

41.

Find the slope given two points: (-9, -2) and (-5, 0)

a)

2

b)

1/2

c)

9

d)

-9

42.
Write the equation of the line.
a)
y= -1x-3
b)
y= -3x-1
c)
y=-1/3x-1
d)
y= -3x-3
43.

What is the equation for this graph?

a)

y = ⅔ x + 3

b)

y = -⅔ x + 3

c)

y = ⅔ x - 3

d)

y = -⅔ x - 3

44.

What is the equation for this graph?

a)

y = ⅔ x + 3

b)

y = -⅔ x + 3

c)

y = ⅔ x - 3

d)

y = -⅔ x - 3

45.

What is the equation for this graph?

a)

y = ⅔ x + 3

b)

y = -⅔ x + 3

c)

y = ⅔ x - 3

d)

y = -⅔ x - 3

46.

What is the equation for this graph?

a)

y = ⅔ x + 3

b)

y = -⅔ x + 3

c)

y = ⅔ x - 3

d)

y = -⅔ x - 3

47.

What is the equation for this graph?

a)

y = 4/3 x + 1

b)

y = 3/4 x + 1

c)

y = 4/3 x - 1

d)

y = 3/4 x - 1

48.

What is the equation for this graph?

a)

y = 4/3 x + 1

b)

y = -4/3 x + 1

c)

y = 4/3 x - 1

d)

y = -4/3 x - 1

49.

What is the equation for this graph?

a)

y = -⅕ x - 2

b)

y = -5x - 2

c)

y = ⅕ x - 2

d)

y = 5x - 2

50.

What is the equation for this graph?

a)

y = -3/7x + 4

b)

y = -7/3x + 4

c)

y = -3/7x + 10

d)

y = -7/3x + 10

51.

What is the equation for this graph?

a)

y = 2

b)

x = 2

c)

0

d)

undefined

52.

What is the slope of the line?

a)

y = 2

b)

x = 2

c)

0

d)

undefined

53.

What is the equation for this graph?

a)

y = 3

b)

x = 3

c)

0

d)

undefined

54.

What is the slope of the line?

a)

y = 3

b)

x = 3

c)

0

d)

undefined

55.

What is the equation of the line?

a)

y = -1

b)

x = -1

c)

0

d)

undefined

56.

What is the slope of the line?

a)

y = -1

b)

x = -1

c)

0

d)

undefined

57.

What is the equation of the line?

a)

y = -1

b)

x = -1

c)

0

d)

undefined

58.

What is the slope of the line?

a)

y = -1

b)

x = -1

c)

0

d)

undefined

59.

Which linear equation?

a)

y = 2x + 3y\ =\ 2x\ +\ 3

b)

y=2x1.5y=2x-1.5

c)

y=3x+2y=3x+2

60.

Which linear equation?

a)

y=2x+3y=-2x+3

b)

y=2x+3y=2x+3

c)

y=1.5x2y=1.5x-2

61.

Which linear eqaution?

a)

y=2x3y=2x-3  

b)

y=2x+3y=-2x+3  

c)

y=2x3y=-2x-3  

62.

Which linear equation?

a)

y=2x3y=-2x-3

b)

y=3x2y=-3x-2

c)

y=2x3y=2x-3

63.

Which line is

y=3x1y=3x-1  

a)
b)
c)
64.

Which line is

y=x2y=x-2  

a)
b)
c)
65.

Which graph is

y=x+1y=-x+1  

a)
b)
c)
66.

Which graph is

y=22xy=2-2x  

a)
b)
c)
67.

Which linear equation?

a)

y=13xy=\frac{1}{3}x

b)

y=3xy=3x

68.

Which linear equation?

a)

y=12xy=\frac{1}{2}x

b)

y=12xy=-\frac{1}{2}x

c)

y=2xy=2x

69.

Which linear graph?

a)

y=12xy=-\frac{1}{2}x  

b)

y=2xy=-2x  

c)

y=2x12y=-2x-\frac{1}{2}  

70.
The cost of Nate’s service is described by y = 4x + 6. The table shows the cost of Beth’s service. Which service is cheaper for 8 movies in one month?
a)
Beth's service ($38 vs. $40) is cheaper
b)
Nate’s service ($42 vs. $44) is cheaper
c)
Nate’s service ($38 vs. $40) is cheaper
d)
Beth's service ($42 vs. $44) is cheaper
71.
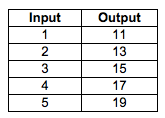
Find the rate of change
a)
1
b)
2
c)
11
d)
Not a constant slope/Non-Linear
72.
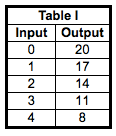
Find the rate of change
a)
3
b)
-3
c)
20
d)
Not a constant slope/Non-Linear
73.
What is the initial value in this equation?
y=8x+6
a)
8
b)
6
74.
What is the rate of change in the equation?
y=8x+6
a)
8
b)
6
75.
Tim bought a new phone.  He paid $125 on the day of purchase, then $50 per month until it was paid off. What is the initial value in this situation?
a)
50
b)
125
76.
Tim bought a new phone.  He paid $125 on the day of purchase, then $50 per month until it was paid off. What is the rate of change in this situation?
a)
50
b)
125
77.

Which function has the GREATEST rate of change?

a)
b)
c)
d)
78.

Which function has the GREATEST initial value?

a)
b)
c)
d)
79.

What is a possible scenario for the given table?

a)

You have $8 and get $5 more each day!

b)

You have $16 and get $2 more each day!

c)

You have $2 and get $6 more each day!

d)

You have $6 and get $2 more each day!

80.

What has the GREATER rate of change. y = 5x +15 OR the graph

a)

y = 5x + 15

b)
81.

What has the GREATER rate of change.

a)

y = 7x + 10

b)

Someone who starts with $6 and gets $8 each day.

c)

y = 5x + 20

d)

Someone who starts with $8 and gets $6 each day.

82.
Is this function linear or nonlinear?
a)
Linear
b)
Nonlinear
83.
Is this function linear or nonlinear?
a)
Linear
b)
Nonlinear
84.
Is the graph pictured a linear or nonlinear function?
a)
Linear
b)
Nonlinear
85.
Is the equation linear or nonlinear?
a)
Linear
b)
Nonlinear
86.
Is the equation linear or nonlinear?
a)
Linear
b)
Nonlinear
87.
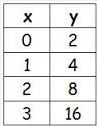
Is the table linear or nonlinear?
a)
Linear
b)
Nonlinear
88.
Is the function linear or nonlinear?
y = x2 + 7
a)
Linear
b)
Nonlinear
89.
Is the function linear or nonlinear?
y = ⅓ x
a)
Linear
b)
Nonlinear
90.
a)
F
b)
H
c)
G
d)
I
91.

Which runner stopped for a rest?

a)

Albert

b)

Bob

c)

Charlie

92.
a)

Opposite Tom's home is a hill. Tom climbed slowly up the hill, walked across the top, and then ran quickly down the other side.

b)

Tom walked home then he stopped and waited to watch the sky. After that, he ran to get home .

c)

Tom was walking to the park. He stopped and waited so the baby chicks could pass.

93.
What happened during O to A point?
a)
not moving
b)
constant speed
c)
accelerating
d)
decelerating
94.

What is a plausible story for this graph?

a)

A student was jogging from school to home. She stopped to tie her shoe and take a drink from her water bottle, then continued at the same pace as before.

b)

A student was jogging from school to home. She walked for a while, then continued jogging.

c)

A sled rider was going down a hill. The hill was steep at first, then kind of flat. At the end, it was steep again.

d)

A car was slowing down, then contued moving at a constant rate. Finally, it slowed to a stop,
95.
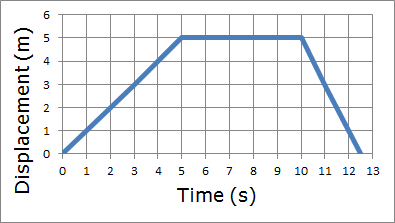
According to the graph how far does the person travel in the first 5 seconds?
a)
2 m
b)
10 m
c)
0 m
d)
5 m
96.

Which of these graphs do not show the object staying still?

a)
b)
c)
d)
97.

What is a plausible description of this graph?

a)

The object began moving away quickly at a constant speed. It stopped. It then turned to return at a constant speed.

b)

The object changed diections three times.

c)

The object began walking away slowly then began running away. Both were at constant speeds. It then turned and walked back to where it started.

d)

The object began moving away at a constant speed. It continued moving away, but slowed its speed. It then turned around and returned home at a speed that was probably in between the first two speeds.
98.

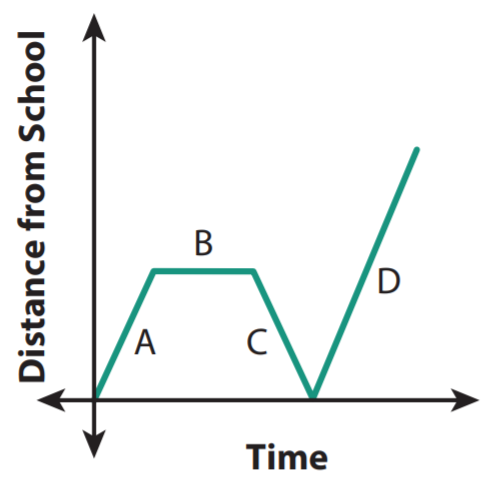
The graph shows Timmy's distance he is as he leaves school one afternoon. What happens in section C? Why is the distance from school decreasing?

a)

Timmy is walking back to school because he forgot his math book.

b)

Timmy is talking to a friend and not walking.

c)

Timmy is walking faster home.

d)

Timmy is dancing in the street.

99.
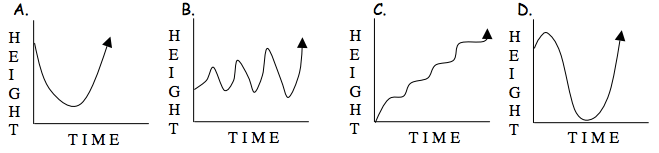
A child is on a swing.
a)
A
b)
B
c)
C
d)
D
100.
A person parachutes from an airplane, free-falls for a while, opens her chute, slows down, and lands on the ground.
a)
A
b)
B
c)
C
d)
D
101.

Between 4 and 8 seconds the helicopter's distance is .....................

a)

Increasing

b)

Decreasing

c)

Staying the same

102.
The sales record for a recent hit CD at Tony’s Music Store is shown on the graph.  Which statement best describes the sales of this CD?
a)
Sales rapidly increased, reached a peak, and then gradually decreased.
b)
Sales gradually increased, reached a peak, and then leveled off.
c)
Sales rapidly increased, reached a peak, and then rapidly decreased
d)
Sales remained constant throughout the time period.
103.
a)

blue

b)

red

c)

green

104.
Between which seconds is the line INCREASING?
a)
Between 7 and 12 seconds
b)
Between 0 and 1 seconds
c)
Between 1 and 5 seconds
d)
Between 12 and 13.5 seconds
105.
Between which seconds is the line DECREASING?
a)
Between 7 and 12 seconds
b)
Between 0 and 1 seconds
c)
Between 1 and 5 seconds
d)
Between 12 and 13.5 seconds
106.
When does the ball hit the ground?
a)
1 second
b)
2 seconds
c)
3 seconds
d)
4 seconds
107.

Over what interval is this function constant?

a)

-5 < x < -2

b)

-3 < x < 4

c)

4 < x < 8

d)

-5

108.
When is the velocity decreasing?
a)
0 < t < 60
b)
40 < t < 60
c)
15 < t < 40
d)
-40 < t < 0
109.
When is this function increasing?
a)
-2.5 < x < 2.5
b)
0 < x < 5
c)
0 < x < 55
d)
-5 < x < 0
110.
How long did it take Sam to get to school?
a)
5 minutes
b)
20 minutes
c)
1.25 km
d)
1.25 minutes
111.
How long did Sam sit on the bench and wait for the bus?
a)
5 min
b)
10 min
c)
15 min
d)
20 min
112.
Over which interval of time is this person returning home?
a)
8:00 < x < 9:00
b)
9:00 < x < 9:30
c)
9:30 < x < 11:00
d)
12:00 < x < 13:00
113.

This graph shows the amount of gas, in ounces, in a lawn mower gas tank, modeled as a function of time.

a)

The maximum amount of gas in the gas tank was 60 ounces.

b)

The amount of gas in the gas tank is at a maximum at 0 minutes.

c)

The gas tank will be empty after 60 minutes.

114.

This graph shows the temperature in the lab for an entire experiment. (Determine which statement(s) is/are true.)

a)

The temperature reached its highest point during the experiment at Hour 12.

b)

The temperature was at its lowest when the experiment began.

c)

The temperature was decreasing for more hours than it was increasing during the experiment.

d)

The temperature at the end of the experiment was equal to the temperature at the beginning of the experiment.

115.

What is happening at D?

a)

Stationary

b)

Accelerating

c)

Fast steady speed; moving away from the starting position

d)

Slower steady speed; moving away from the starting position

116.

What is happening at E?

a)

Stationary

b)

Accelerating

c)

Fast steady speed; moving away from the starting position

d)

Steady speed; returning to start position

117.

What label is along the y-axis in this graph?

a)

Copyright 2007

b)

Lines

c)

Age in Years

d)

Number of Teens

118.

How much does it cost to have your lawn mowed for 2 hours?

a)

$16

b)

$17

c)

$18

d)

$19

119.
Which runner stopped for a rest?
a)
Albert
b)
Bob
c)
Charlie
120.
Which statement below accurately represents the graph?
a)
$100 is earned for each hour worked
b)
$100 is earned for every 2 hours worked
c)
$500 is earned for every 8 hours worked
d)
$200 is earned for every 3 hours worked
121.

The graph shows the top selling food items from a local restaurant. The managers are comparing the type of food sold during different years. What conclusion could the managers make about the type of food sold?

a)

Fish and chips were the most popular food sold over time

b)

Pizza increased the most over time

c)

In 1980, hamburgers sold the most while pizza sold the least

d)

In 1990, pizza was sold the most while hamburgers were sold the least