
 Worksheets
Statistics Mini Unit Quiz
Total questions: 50
Worksheet time: 42mins

How many students had more than 6 candy bars?
(a)

Which of the following is true for the graph?
The range of the graph is 9
2 and 3 are normal responces so they would never be considered outliers
7 is the mode of the graph
8 is the median of the graph

Box Plot
Stem and Leaf

44-54

Creating a table like this would be used to create which of the following plots
Line Graph
Histogram
Box Plot
Circle Graph
Scatter Plot

64

This plot show how many point was scored on a video game. What is the range of the data set?
(a)

Which of the following are true for the graph shown above
Nashville has a bigger interquartile range
Dallas has a bigger interquartile range
Dallas has a bigger range
Dallas has a higher median
Nashville has a higher median
The students’ test scores in Mr. Stancil’s class are listed below.
73, 81, 95, 78, 85, 92, 95, 88, 84
What is the median of the test scores?
(a)

Which car has the widest range of jumping distance?
Car A
Car B
Both the same
Undefined

What is the sample size of the survey?
50
150
100
200

If there are 300 seventh graders, how many students prefer choir?
96
24
75
42

There are 400 students at the school. Predict how many students would prefer science.
(a)

If 90 students were to take the quiz, how many would you predict would make a B?
(a)

Explain why this graph may be misleading?
the x-axis does not have equal intervals
San Francisco is too big for the sample
you cannot have percents in a line graph
the y-axis does not have equal intervals

The graph shows the results of a survey to determine student's favorite pets. Why is this graph misleading?
The slices are the wrong color
The slices are not the correct size
The percents do not add up to 100
Not misleading

What is misleading about this graph?
**choose the best answer
Nothing is misleading about this graph.
The democrats are too high.
The y-axis does not start at zero, so it makes the democrats look much higher than the other two parties.
The x-axis is not evenly spaced, so the data is stretched making it appeared skewed
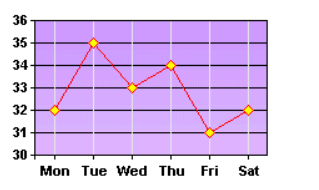
Why is this graph misleading?
broken scale (doesn't start at 0)
uneven values on vertical axis
unequal spacing of lines
none of the above

What is wrong with this graph?
Not enough information.
The basketball ticket prices in 2001 were approximately 2 times as much as 1991, yet the size of the basketballs are about 4 times as big.
y axis scale is not uniform (broken scale)
The x-axis is not evenly spaced so it causes a data stretch and skews the information.

You are at the movies with your friends and decided to buy a small bag of gummy bears. There are 4 red bears, 5 green bears, and 3 yellow bears in the bag. What is the probability that you will get yellow gummy bears and then red gummy bears?
The probability is 3/11
The probability is 1/11
The probability is 3/132
The probability is 3/12
The probability is 3/12
You are at the movies with your friends and decided to buy a small bag of gummy bears. There are 4 red bears, 5 green bears, and 3 yellow bears in the bag. What is the probability that you will get yellow gummy bears or a red gummy bears?
The probability is 3/11
The probability is 1/11
The probability is 3/132
The probability is 3/12
The probability is 7/12
There are 6 red marbles, 5 green marbles, and 4 yellow marbles in a bag. If Joe picks 2 marbles one after the other without replacement, then what is the probability that both are red in color?
2/5
1/21
4/25
1/7
11/29

You roll a six sided die. What is the probability of rolling an even number three times in a row?
3/100
1/2
1/6
1/8
1/4
Bag A contains 9 red marbles and 3 green marbles. Bag B contains 9 black marbles and 6 orange marbles. Find the probability of selecting one green marble from bag A and one black marble from bag B.
3/20
1/4
3/31
2/27
1/7
How many outcomes are there with tossing a coin and rolling a dice?
2
6
12
24
36

Theoretically, how big is the sample space (total outcomes) when solving problems about the sum of 2 dice probability.
6 boxes
12 boxes
18 boxes
24 boxes
36 boxes
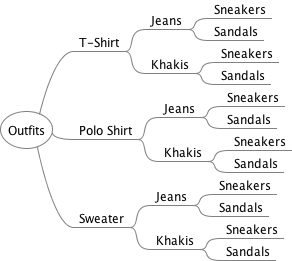
There are 3 types of shirts, two pairs of pant and 2 types of shoes, based on the tree diagram, how many total outfit options are represented?
12
22
3
7
18
A basket contains 5 purple pencils and 9 brown pencils. If two pencils are picked at random one after the other without replacement, then what is the probability that both the pencils are purple?
9/182
5/182
2/91
10/91
25/196
There are 2 violet balls and 4 pink balls in a bag. If two balls are drawn one after the other, then what is the probability of getting violet first and pink next, if the first ball drawn is replaced?
1/3
2/9
1/6
1/4
4/15

What percent of female athletes surveyed play basketball?
16%
52%
23%
31%
13%

According to the two-way table, a person who plays an instrument is most likely to:
Not play an instrument
Not play a team sport
Play a team sport
All of the above

What is the probablity the next student that walks up will order water and no food
1/30
1/20
1/7
1/3
not enough information

What percent of the total population surveyed were electrical engineers that like math?
33.9%
48.6%
16.5%
21.7%

What is the percentage of students that are between the ages 10 - 13 and eat breakfast?
About 33%
About 50%
About 40%
About 44%
About 74%
Identify the Population:
Wicomico County Public Schools randomly selected 230 teachers to find out which technology resource it's teachers feel is the most effective.
230 Teachers
All Wicomico County Teachers
Students
Wicomico County Public Schools
Identify the Sample:
Wicomico County Public Schools randomly selected 230 teachers to find out which technology resource it's teachers feel is the most effective.
230 Teachers
All Wicomico County Teachers
Students
Wicomico County Public Schools
50 students were surveyed about their favorite drinks. 11 orange soda, 17 pepsi, 10 coke, and 12 said grape. What percent of students like coke as their favorite?
2%
10%
20%
50%
5%

The table shows the results of a survey of 200 people attending a hockey game.
The attendance for the hockey game is about 25,000 visitors each game. Based on the table, how many people out of 25,000 could be expected to buy a pennant?
(a)
A high school has 1500 students. In a random sample of 50 students, 32 own one or more pets. Predict the number of students at the high school who own one or more pets.
(a)
Which example(s) shows CAUSATION? Check all that apply
High social media usage and number of friends
Car ran out of gas and being stranded on the side of the road.
Recess time and playing in the band
An ant eats poison and the ant dies
Drinking a soda every day and getting diabetes
Which example shows CORRELATION?
I put water in the freezer and now I have ice.
The alarm clock went off and I woke up.
Temperature and the amount of people at the beach.
Drinking a soda every day and getting diabetes
The amount of cats living in a barn and the amount of mice living in that same barn
Data is analyzed comparing hours studied and grades. It is determined that the correlation coefficient is 0.92. What does this mean?
There is a strong positive correlation between studying and grades.
There is a strong negative correlation between studying and grades.
There is a weak positive correlation between studying and grades.
There is a weak negative correlation between studying and grades.
There is a no correlation between studying and grades.
Data is collected comparing sales of cars and the age of the salesperson. After analyzing the data, it is determined that the correlation coefficient is 0.19. What does this mean?
There is no correlation between sales and age.
There is a strong positive correlation between sales and age.
There is a strong negative correlation between sales and age.
There is a weak negative correlation between sales and age.
Not enough information
Data is collected comparing minutes of exercise each day and blood pressure. It is determined that the correlation coefficient is -0.87. What does this mean?
There is a strong negative correlation between exercise and blood pressure.
There is a weak negative correlation between exercise and blood pressure.
There is a strong positive correlation between exercise and blood pressure.
There is no correlation between exercise and blood pressure.
There is a weak positive correlation between exercise and blood pressure.
Which correlation coefficient shows the WEAKEST negative correlation?
-0.73
- 0.34
- 0.92
- 0.57
0.28

Estimate the correlation coefficient for this scatterplot.
r = -0.9
r = 1
r = 0.9
r = -1
r=-0.28

Beverly did a study this past spring using data she collected from a cafeteria. She recorded data weekly for ice cream sales and soda sales. Beverly found the line of best fit and the correlation coefficient, as shown in the diagram to the left.
Given this information, which statement(s) can correctly be concluded?
I. Eating more ice cream causes a person to become thirsty.
II. Drinking more soda causes a person to become hungry.
III. There is a strong correlation between ice cream sales and soda sales.
I. only
I. and III.
III. only
II. and III

The scatter plot below represents the relationship between the number of peanuts a student eats and the student's bowling score. Which conclusion about the scatter plot is valid?
There is almost no relationship between eating peanuts and bowling score.
Students who eat more peanuts have higher bowling scores.
Students who eat more peanuts have lower bowling scores.
No bowlers eat peanuts.
Every bowler eats the same amount of peanuts

