
 Worksheets
Exponential Functions and Graphs
Total questions: 35
Worksheet time: 37mins
A=1200(.85)6


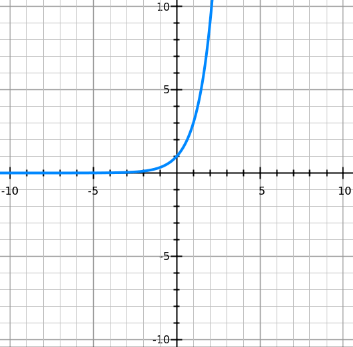
What does this graph represent?
Exponential Decay
Exponential Growth
What is the initial value of the situation represented by f(x)=0.05(2)x?
0.05
2
0.1
1
What is the asymptote of the parent function y=2x?
x=0
y=0
x=2
y=2

g(x) = -2(x+3) -6


Does the function y=21(2)x−5 model exponential growth or decay?
Growth
Decay
Neither
Both
Does the function y=(21)x+3 model exponential growth or decay?
Growth
Decay
Both
Neither

What could the equation of the exponential function in the graph be?
y = 2x + 2
y = (1/2)x + 2
y = 1/2(4)x + 2
y = 2x - 2

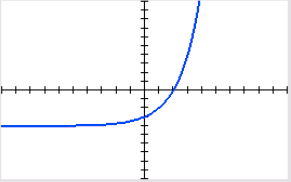
What could the equation of the exponential function in the graph be?
y = (1/2)x - 1
y = (1/2)x + 1
y = 2x - 1
y = 2x + 1
The graph of y=4x−2 looks like the graph of the parent function y=4x shifted ...
up 2 units
down 2 units
2 units in the negative x direction (left)
2 units in the positive x direction (right)
The graph of y=2x+3 looks like the graph of the parent function y=2x shifted ...
up 3 units
down 3 units
3 units in the negative x direction (left)
3 units in the positive x direction (right)
The graph of y=−5x looks like the graph of the parent function y=5x ...
reflected over the Y axis
reflected over the X axis
shifted up 5 units
shifted down 5 units

The graphs of y=2x and y=2x+k are shown. What must the value of k be?
2
-2
5
-5

The graphs of y=2x and y=2x+k are shown. What must the value of k be?
2
-2
1
-1

The graphs of y=2x and y=2(x−h) are shown. What must the value of h be?
3
-3
7
-7

The graphs of y=2x and y=2(x−h) are shown. What must the value of h be?
2
-2
4
-4
Determine the range for the function.
f(x)=2x−4+5
y > 4
y > 2
y > 3
y > 5

Name the asymptote.
x = -4
y = -5
y = -4
x = -5
Name the range.
x> -4
y > -5
y < -4
x < -5

Name the asymptote.
x = 1
y = 2
y = 1
x = 2

Name the range.
x> 2
y < 3
y < 2
y>2

