
 Worksheets
AQR Unit 5_Statistical Studies Review_ROSS
Total questions: 50
Worksheet time: 2hrs 40mins
To test the effects of eating breakfast on test grades. I randomly select half of my students and feed them breakfast while giving the other half nothing to eat. I then give them all a test and compare the test grades of each group.
Is this an experiment or an observational study?
Experiment
Observational study
Neither
Both experiment and observational study.
A hospital wants to open a gym. They ask the night-shift ER staff when they would use the gym. Is this sample biased or unbiased?
Biased
Unbiased
Not able to be determined.
A researcher stood at a school parking lot entrance to see if the color of a car is related to the driver not wearing a seat belt.
Which research method is most appropriate?
Observational Study
Experiment
Census
Correlation
Interview every 10th student who enters the school in the morning.
simple random
voluntary response
systematic
convenience
Assign each car in a dealership a number and then use a random-number table to select the cars to be inspected.
systematic
simple random sample
convenience
Self - selected (volunteer)
Marianne wanted to know students' opinion on the new schedule at school. She survey's the first 30 students who come into her class.
Convenience Sampling
Systematic Random Sampling
Simple Random Sampling
Volunteer response
A teacher splits her classes up by period. She then randomly picks 3 students from each period to do a survey.
Stratified.
Systematic
Cluster
Biased.
The entire group of individuals we want information about in a statistical study.
sample
census
population
survey
the small group we collect data from to generalize for a larger group.
population
census
sample
survey
The design of a study that consistently underestimates or overestimates the value you want to know.
Nonresponse
Bias
Voluntary response
undercoverage
The fact that difference random samples of the same size from the same population produce different estimates
sampling variability
bias
undercoverage
nonresponse
an estimate that describes how far, at most, we expect the estimate to vary from the true population value
hypothesis
margin of error
sampling variability
______________ occurs when some members of the population are less likely to be chosen or cannot be chosen for the sample
undercoverage
nonresponse
voluntary response
response bias
_____________ occurs when there is a consistent pattern of inaccurate responses to a survey question (due to wording of survey, interviewer, etc.)
nonresponse
undercoverage
voluntary response
response bias
_____________ occurs when an individual chosen for the sample can't be contacted or refuses to participate.
undercoverage
nonresponse
voluntary response
response bias
A ___________________ is a group used to provide a basline for comparing the effects of other treatments.
treatment group
control group
a treatment that has no active ingredient, but is otherwise like other treatments
placebo
control group
treatment group
In an experiment, this is when either or both the subject and the interviewer do not know which treatment is being given.
blinding
placebo
placebo effect


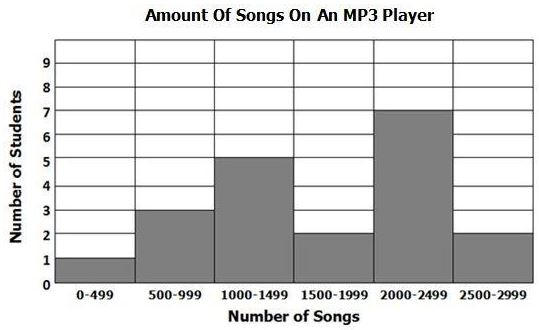


Select the graph that has a normal shape.


Select the graph that is skewed right.
Select the graph that is skewed left.

Match the shape of the box and whisker to the shape of the histogram.


Match the shape of the box and whisker to the shpae of the histogram.

Match the shape of the dot plot to the shape of the histogram.


Where is Q1?
5
10
17
20
32
Where is the median?
5
10
17
20
32
Where is Q3?
5
10
17
20
32
Where is the maximum?
5
10
17
20
32

4. Which of the following lists all parts of the five number summary (what you need to make a box and whisker plot)?
Mean, Median, Mode, Range, and Total
Minimum, Quartile 1, Median/Quartile 2, Quartile 3, and Maximum
Smallest, Q1, Q2, Q3, and Q4
Minimum, Maximum, Range, Mean, and Median

What is the MEDIAN of this data? Hint: there are 13 pieces of data. Which one would be in the middle?
95
90
100
40


How do we reduce variability?
Increase randomness.
Increase sample size.
Decrease randomness.
Decrease sample size.

