
 Worksheets
Climate Change
Total questions: 54
Worksheet time: 2hrs 22mins
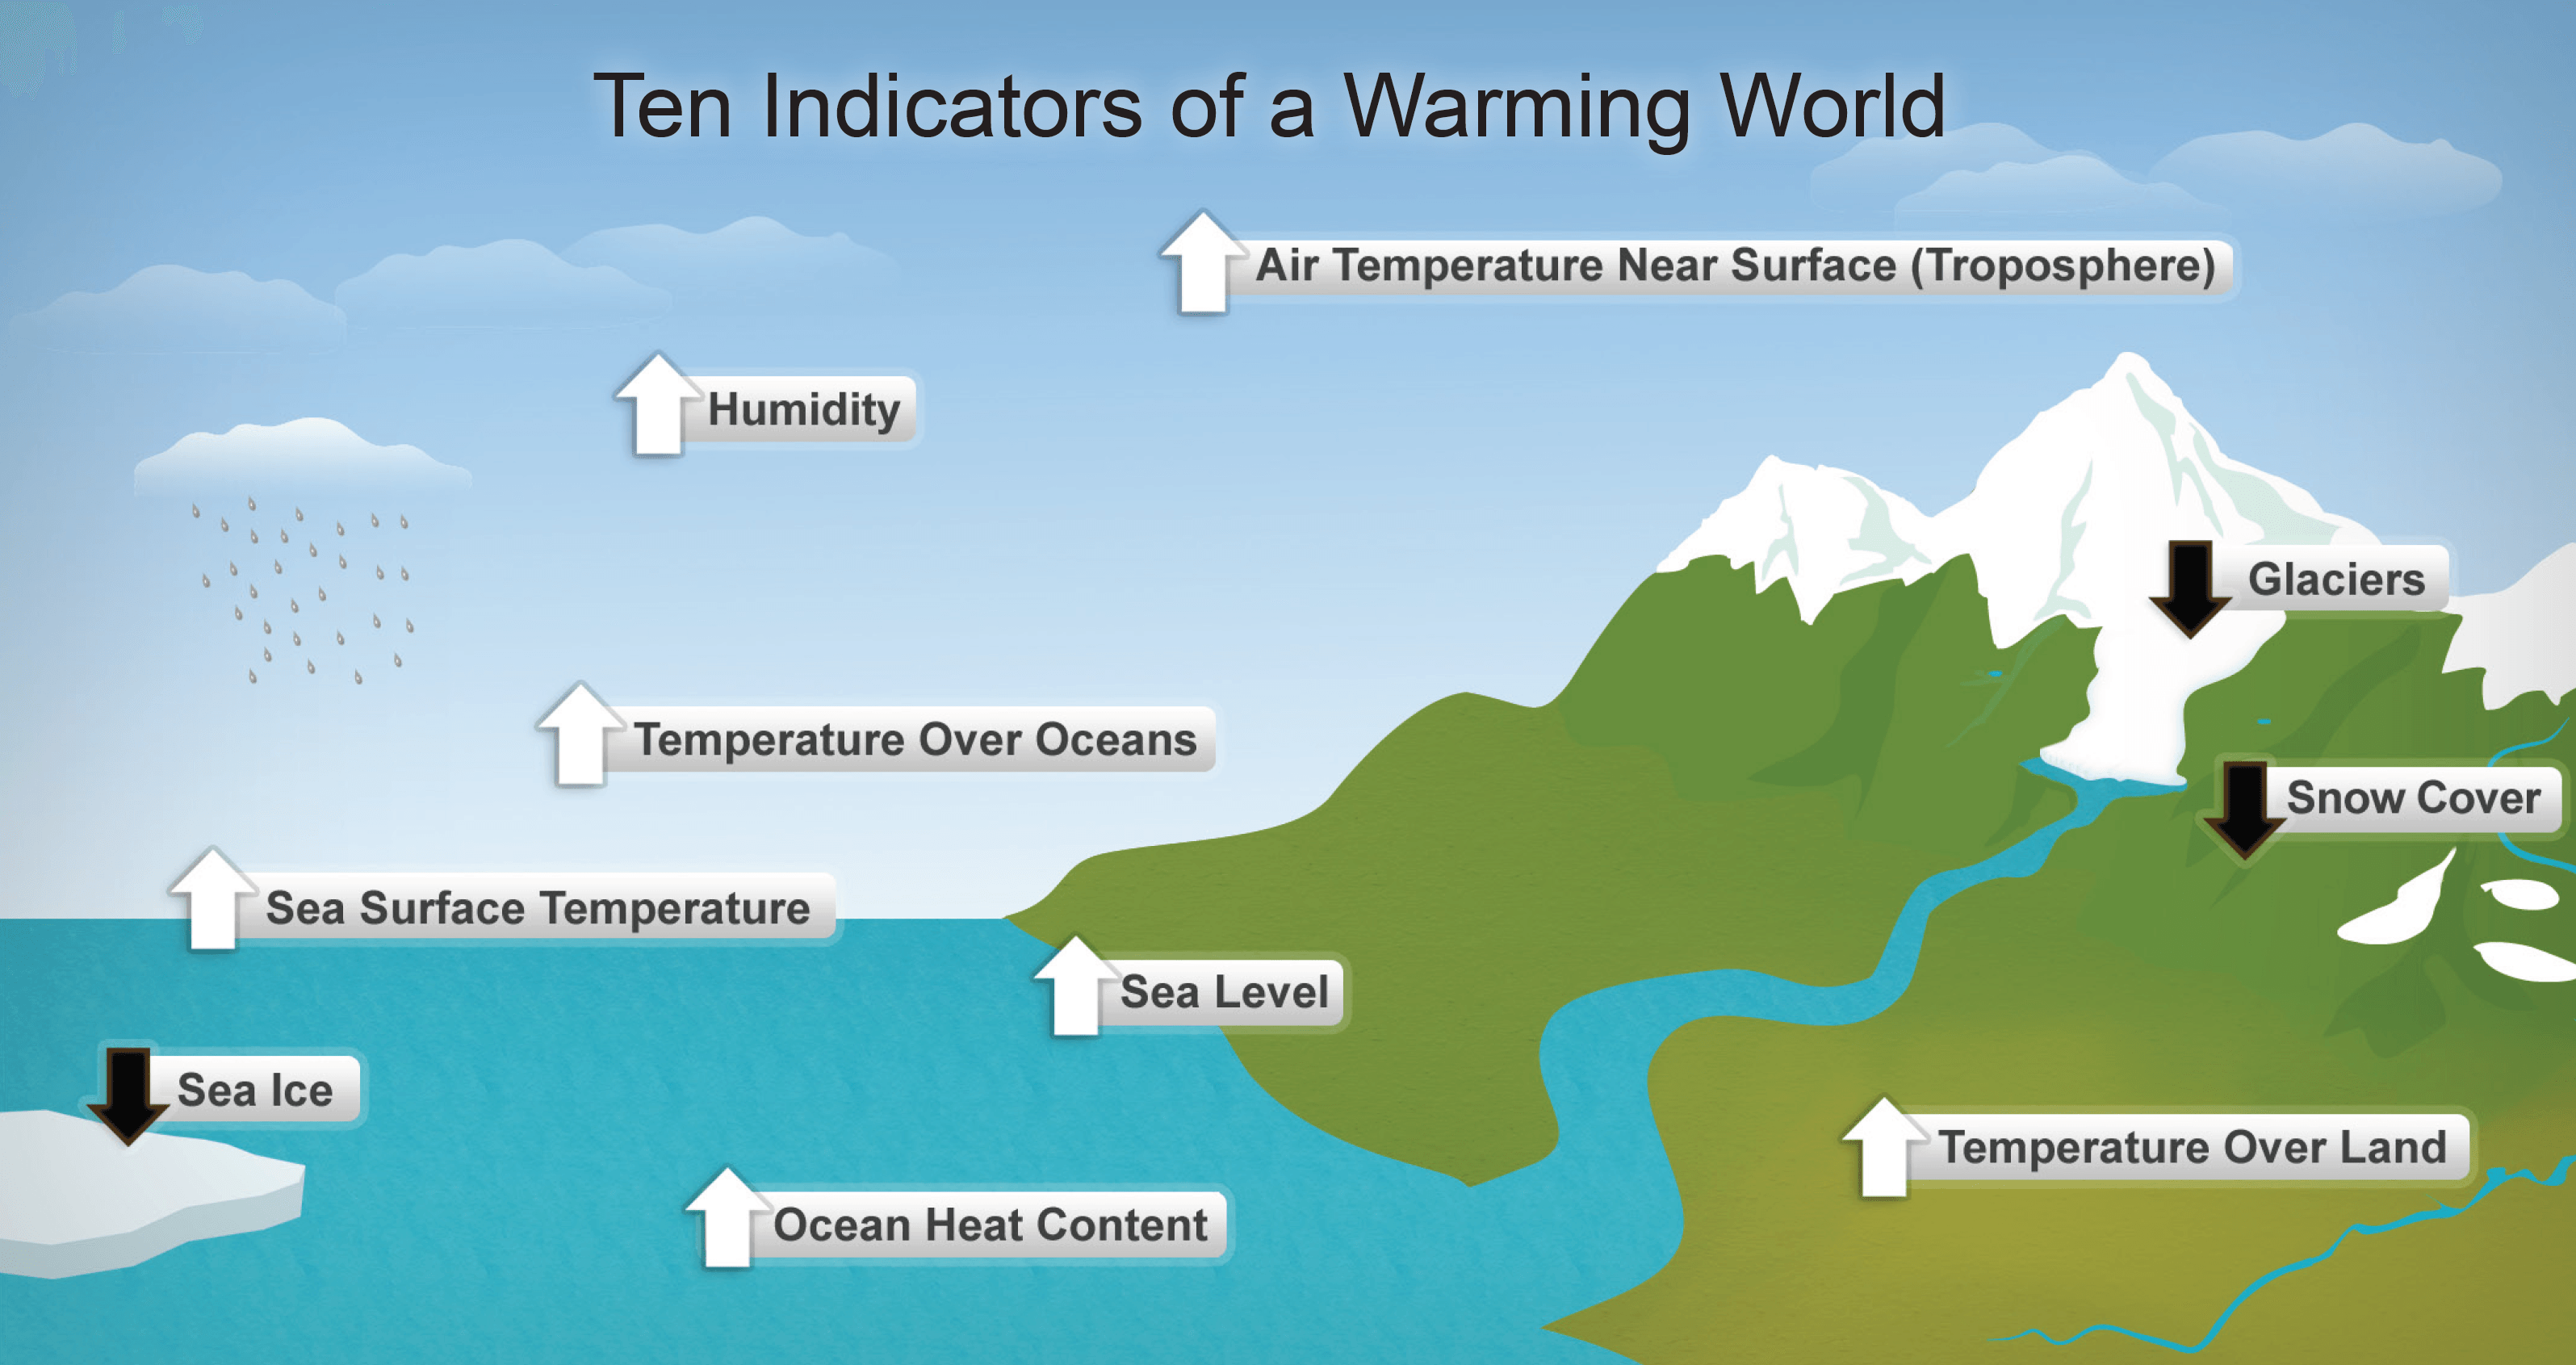
What is the direct cause of rising sea levels?
Melting Sea Ice
Melting Land Ice
Climate Change

The main human activity that releases greenhouse gases is
riding bicycles
burning fossil fuels
texting on cellphones
eating meat

These graphs show increases in greenhouse
gasses in Earth’s atmosphere. As levels of
greenhouse gasses have increased, the
temperature of Earth’s surface has risen.
Which change has most likely contributed to a
rise in surface temperatures on Earth?
The world birth rate dropped to less than 22
births per 1,000 people per year.
The president of the United States signed a law
that created one of the country’s largest nature
parks.
Farmers increasingly use chemical fertilizers
that allow nitrogen and phosphorous to enter
water sources.
Humans began using work-saving technologies
that release carbon dioxide and methane.

The graph shows the increase in atmospheric
carbon dioxide concentration over several
decades.
Increasing carbon dioxide levels will directly affect
Earth's....
magnetic and gravitational fields.
weather and climate systems.
mantle convection.
rotation speed.

The graph shows changes in carbon dioxide
(CO2) concentrations and surface temperatures
on Earth from the years 1880 to 2000.
Why do carbon dioxide concentrations and
surface temperatures show the relationship seen
in the graph?
because lower carbon dioxide levels mean more
heat is retained in Earth's atmosphere
because higher carbon dioxide levels mean
more heat is retained in Earth's atmosphere
because lower carbon dioxide levels mean less
heat is retained in Earth's atmosphere
because higher carbon dioxide levels mean less
heat is retained in Earth's atmosphere

The graph shows changes in the levels ofatmospheric carbon dioxide over time. What might be one way to reverse the trend shown in the graph?
Increase the rate of deforestation.
Increase the rate of respiration.
Use more fossil fuels.
Plant more trees.
Which of the following is largely responsible for
depleting Earth's ozone layer?
PCB's
DDT
CFC's
CO2
What is the greenhouse effect?
the effect of the Sun's radiation on the
chlorophyll in plant cells
the economic effect of climate change on the
United States' government
the increase of Earth's temperature due to heat
energy being trapped by certain atmospheric
molecules
the decrease in the temperature of Earth's
ocean currents due to atmospheric gases
blocking the Sun's radiation
What does the term carrying capacity describe?
The maximum number of birth rates for a population.
The ability of a population to accept new immigrants.
The ratio of birth rates to death rates in a population.
The population size that the environment can sustain.
If a population grows larger than its environmental carrying capacity, then
death rate may rise.
death rate may fall significantly.
birth rate may rise significantly.
immigration rate may increase.
Health and disease can determine a population's
life or death
hopes and dreams
happiness or discontent
religious beliefs or politics
Experts strongly disagree over
how to define exponential growth
the predicted world population for the year 2050
whether the human population will stop growing
how much the human population has grown in the last 500 years
In most areas of the world today
people are richer than ever in human history
people are smarter than ever in human history
people weigh more than ever in human history
people live longer than ever in human history
Which of the following gases does not trap heat?
A. Carbon dioxide
B. Nitrogen
C. Water vapor
D. Methane
Which 2 greenhouse gases contribute the MOST to global warming of Earth?
N2O and H2O
O3 and H2O
CO2 and CH4


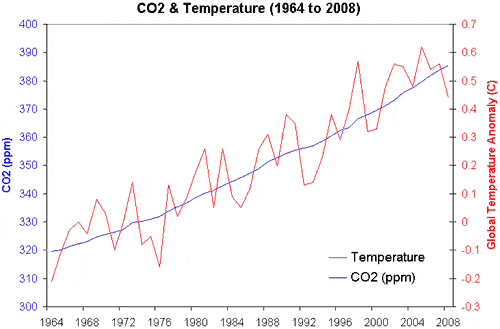
The graph below shows CO2 emissions and temperatures from 1909 to 1949. What conclusion is best supported by the graph?
There is no relationship between carbon dioxide concentrations and temperatures
As carbon dioxide concentrations increase, temperatures increase
As carbon dioxide concentrations increase, temperatures decrease
As carbon dioxide concentrations decrease, temperatures increase
The graph below shows CO2 emissions and temperatures from 1909 to 1949. What conclusion is best supported by the graph?
There is no relationship between carbon dioxide concentrations and temperatures
As carbon dioxide concentrations increase, temperatures increase
As carbon dioxide concentrations increase, temperatures decrease
As carbon dioxide concentrations decrease, temperatures increase
The graph below shows CO2 emissions and temperatures from 1909 to 1949. What conclusion is best supported by the graph?
There is no relationship between carbon dioxide concentrations and temperatures
As carbon dioxide concentrations increase, temperatures increase
As carbon dioxide concentrations increase, temperatures decrease
As carbon dioxide concentrations decrease, temperatures increase

How is the greenhouse effect produced?
When solar energy trespasses the atmosphere.
When some energy is reflected back to earth.
When the green house is burned.
When the sun doesn't emit radiation.
How are greenhouse gasses harming our environment?
They aren't
Less heat is able to escape causing the Earth to cool down
Less heat is able to escape causing the Earth to warm up
More heat is able to escape
Which of the following could increase the amount of greenhouse gasses in our atmosphere?
Burning fossil fuels
Planting trees
Walking to school and work
Cutting down trees


If a population grows larger than its environmental carrying capacity, then
death rate may rise.
death rate may fall significantly.
birth rate may rise significantly.
immigration rate may increase.
What does the term carrying capacity describe?
The maximum number of birth rates for a population.
The ability of a population to accept new immigrants.
The ratio of birth rates to death rates in a population.
The population size that the environment can sustain.

