
 Worksheets
Chemistry of Climate Change Unit Practice
Total questions: 71
Worksheet time: 1hrs 11mins
What is the carbon cycle?
the series of processes by which carbon compounds are interconverted in the environment
When fossil fuels are burned
Photosynthesis
The process of carbon moving between the land and air, causing climate change.
What is a greenhouse gas?
A gas that can absorb UV light
A gas that can absorb infrared light
A gas that can absorb visible light
A gas found in a greenhouse
Which of the following is NOT a greenhouse gas?
Ozone
Chlorofluorocarbons
Nitrogen
Methane
What is the greenhouse effect?
Climate change
The sole source of heat for Earth
The process in which heat is trapped in the atmosphere.
A natural process that traps air in the atmosphere.
Global warming is the
process of using greenhouse gases to trap heat in the atmosphere
observed and predicted rise in Earth's average surface temperature
change in global weather patterns
melting of the polar ice caps.
A greenhouse gas has the unique ability to
move through the atmosphere
act like the sun
absorb heat
stay in one place in the atmosphere

By what amount did carbon dioxide in earth's atmosphere increase between 1960 and 2000?
40 - 50 ppm
60 - 70 ppm
110 - 120 ppm
360 - 370 ppm
The average temperature of the surface of Earth has increased approximately 1 °C in the past century. Which reason best explains this increase in temperature?
higher levels of carbon dioxide and other greenhouse gases in the atmosphere
lower levels of ozone in the atmosphere
higher levels of oxygen in the atmosphere
lower levels of nitrogen in the atmosphere

Methane and ................ are greenhouse gases.
oxygen
nitrogen
carbon dioxide

The temperature of the Earth is increasing because the concentration of greenhouse gases in the atmosphere is _________.
increasing
decreasing
staying the same
Deforestation leads to an increase in carbon dioxide levels in the atmosphere. Land cleared by deforestation is often used to rear cattle. Rearing cattle affects further the atmosphere because _________, another greenhouse gas, is released as a product of the cattle's digestion.
nitrogen
methane
oxygen

The graph shows that the global average temperature is rising. One impact of this is that water in the oceans is expanding, causing sea levels to . . .
rise
fall
stay the same

Do the graphs provide direct evidence of a link between human activity and global warming? Justify your answer.
Select yes or no and a justification.
yes
no
The increases in carbon dioxide and global temperature follow a similar pattern.
The increases in carbon dioxide and global temperature follow a similar pattern, but the graphs don't tell you directly how human activity is involved.

Does the information in the image provide evidence for a link between human activity and increasing carbon dioxide levels in the atmosphere? Justify your answer.
Select yes or no and a justification.
yes
no
It provides evidence that carbon dioxide levels have risen, rather than explaining why they have risen.
Carbon dioxide levels have gone up. This is because humans are burning more fossil fuels.

The diagram summarises the continuous recycling of carbon through plants and animals. Which process transfers glucose from a plant to an animal?
photosynthesis
respiration
feeding

The diagram summarises the continuous recycling of carbon through plants and animals. Which two arrows on the diagram indicate carbon dioxide being returned to the atmosphere by respiration?
A
B
C
D

The diagram summarises the continuous recycling of carbon through plants and animals. The reaction in plants and animals that releases carbon dioxide into the atmosphere is called ____________.
photosynthesis
respiration
feeding

The graph shows the percentage of carbon dioxide in the atmosphere between 1700 and 2000. Which option describes how levels changed from 1700 to 1800?
There was very little change in the percentage of carbon dioxide.
The percentage of carbon dioxide fell.
The percentage of carbon dioxide increased significantly.
_____________ is the removal of trees over a large area.
Destruction
Reforestation
Deforestation

The graph shows the change in the atmosphere's carbon dioxide levels over the last 800,000 years. Select the best description for what the graph shows.
The patterns of variation in carbon dioxide levels have been consistent.
Carbon dioxide levels have increased steadily over the period shown.
There has been lots of variation in the amount of carbon dioxide, but recently it has become significantly higher.

The pie chart illustrates how the actions of the average individual contributes to their carbon emissions. What is the total percentage contributed by travel?
12%
29%
2%
43%
The pie chart illustrates how the actions of the average individual contributes to their carbon emissions. What is the total percentage contributed by heating?
11%
30%
41%
Where can you find carbon?
Only in Earth's atmosphere
Inside all water molecules
Inside the sun
Inside every living thing on Earth

There are yearly highs and lows in this carbon dioxide graph. Which of the following could be the cause for this?
Humans burn more fossil fuels in late summer to cool their homes creating a spike in CO2
Decaying leaves release CO2 from respiration and increase levels over winter
Plants only photosynthesize in the winter therefore CO2 spikes in the fall.
atmospheric carbon dioxide levels have increased steadily since 1960
Which atmospheric gas is responsible for increasing the acidity of the ocean?
Nitrogen
Oxygen
Carbon Dioxide
Water Vapor
In a positive feedback loop, each action creates a consequence that _____________________ the other action.
decreases
has no effect on
amplifies
In a negative feedback loop, each action creates a consequence that _____________________ the other action.
decreases
has no effect on
amplifies
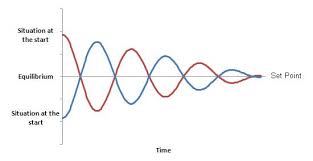
Does the graph show positive or negative feedback?
Positive, because when the red line shifts, the blue one does also
Negative, because the blue line starts below equilibrium
Negative, because the two actions are keeping each other near equilibrium
Both positive and negative because the graph moves up and down
As the ocean heats up, what happens to the amount of dissolved CO2?
It increases
It decreases
It doesn't change

Why does land heat up and cool down faster than water?
Water has a higher albedo to reflect the heat.
Water does not heat up fast, but holds heat well.
Land has a lower specific heat and does not take as much energy to heat.
All are correct.

The following is an example of what type of feedback loop?
Negative Feedback Loop
Neutral Feedback Loop
Positive Feedback Loop
Global Warming Feedback Loop
What would happen to gloabal sea levels if global temperatures decreased leading to more ice in the arctic?
Sea levels will Increase
Sea levels will decrease
Sea levels will remain the same
Not enough information
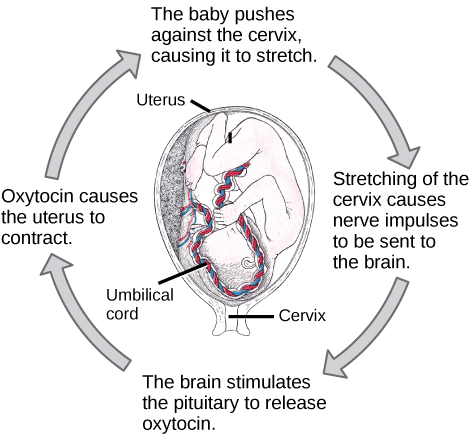
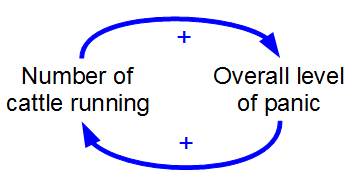

Which is an example of a negative feedback loop?
Decreasing temperature ➜increase in ice cover ➜increase in reflection of sunlight ➜decrease in temperature
Decreasing temperature ➜decrease in plant cover ➜decrease in absorption of carbon dioxide ➜increase in temperature

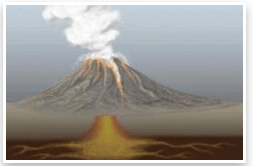
Which is an example of anegative feedback loop?
Decreasing temperature ➜increase in ice cover ➜increase in reflection of sunlight ➜decrease in temperature
Decreasing temperature ➜decrease in plant cover ➜decrease in absorption of carbon dioxide ➜increase in temperature




Based on the graph, when did carbon dioxide levels start increasing more than normal?
They have always been increasing
The industrial revolution
When we went to space
The day that Mr. Gale was born
Scientists collect data on climate all around the world. They then input this data into a mathematical or computer-based model to simulate real-world conditions.
True
False
What is the main cause of global changes in climate over long periods of time?
Variations in the flow of energy in Earth's system
Fluctuations in the sizes and positions of continents
Changes in the variety and complexity of plants and animals
Interactions between Earth and the most massive planets
Which of the following would most likely lead to a cooler global climate?
A slower rotation of Earth, leading to permanent lengthening of periods of both daylight exposure and darkness on Earth
Volcanic activity sufficient to produce ash clouds that cover a significant portion of Earth's atmosphere for an extended period of time
Melting of polar ice caps that leads to a rise in sea level over the entire planet and less available habitat for land-dwelling plants and animals
Human activity, including the burning of fossil fuels that increases the amount of carbon dioxide and other gases that trap thermal energy in the atmosphere
Many scientists believe a meteor strike caused the extinction of the dinosaurs. A competing theory is a series of massive volcanic eruptions in India caused the extinction. How could volcanic eruptions cause a worldwide mass extinction event?
Lava flowing form the volcanoes changes the landscape, destroying habitats
Volcanic eruptions add carbon dioxide to the atmosphere, resulting in an increase in global temperatures
Large volumes of volcanic ash in the atmosphere can cause a decrease in Earth's global temperatures
Volcanic ash from the eruptions fell into and polluted water sources worldwide
The atmosphere of early Earth was composed of high levels of carbon dioxide with very little oxygen. After photosynthetic organisms developed, the level of oxygen in Earth’s atmosphere increased and the level of carbon dioxide decreased. How did this change in the atmosphere affect the global climate on Earth?
The global climate became variable with temperature swings from hot to cold.
There was little to no effect on the global climate from the change.
The global climate became warmer with the increase of oxygen in the atmosphere.
The global climate became cooler with the decrease of carbon dioxide in the atmosphere.
Earth is dependent on radiation from the Sun for energy. The amount of solar radiation varies daily, depending on the weather, and seasonally, depending on Earth's orientation. What phenomenon causes a variation in the Sun's output over an 11-year cycle?
Elongation of Earth's orbital path
Earth’s change in tilt from 22.1º to 24.5º
Series of multiple volcanic eruptions
Change in the number and orientation of sunspots

