
 Worksheets
Physics - displacement, velocity, acceleration review
Total questions: 50
Worksheet time: 4hrs 10mins
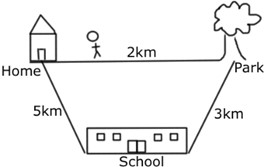
Jerry walked from home to school, then from the school to the park. What is his total displacement?
2 km
5 km
8 km
10 km
Jerry walked from home to school, then from the school to the park. What is his total distance?
2 km
5 km
8 km
10 km
A cat walks 3 meters toward a laser, then jumps 5 meters due south of the laser when it sees a thing. What is the displacement of the cat (to the nearest tenth)?
3.0m
5.0m
8.0m
5.8m


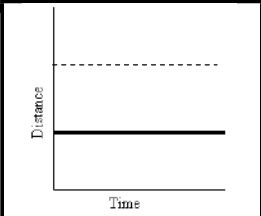
Jose wandered 4 km at 2 km/hr. How long did Jose wander?
2 hours
8 hours
0.5 hours
2 km
A vehicle travels 2345 m in 315 s toward the evening sun. What is its speed?
7.44 m/s
0.13 m/s
738,675 m/s
7.44m
What distance will a car traveling 65 km/hr travel in 180 min?
11,700 m
195 m
21.7 m
2.77 m
How long will it take to go 150,000 m traveling at 50 km/hr?
3000 hours
3000 sec
3 hours
3 sec
What distance will be traveled if you are going 120 km/hr in 30 min?
3600 km
60 km
4 km
40 km
A car travels 240 km in 2 hours and a sprinter travels 100 m in 9.5 sec. Who is traveling faster?
the car
the sprinter
they are traveling the same speed
not enough information to answer this question
It took Shawn 6 hours to walk to Susan's house at 2 km/hr. How far is it between Shawn's house and Susan's house?
12 km
3 km
12 hours
3 hours
A train travels 120 km in 2 hours and 30 minutes. What is its average speed?
60 km/hr
240 km/hr
48 km/hr
300 km/hr

A position-time graph of an athlete winning the 100-m run is shown. Estimate the time taken by the athlete to reach 65 m.
6.0 s
6.5 s
5.5 s
7.0 s

A position-time graph of an athlete winning the 100-m run is shown. What was the instantaneous position of the athlete at 2.5 s?
15 m
20 m
25 m
30 m
A position-time graph of an athlete winning the 100-m run is shown. What was the instantaneous position of the athlete at 2.5 s?
15 m
20 m
25 m
30 m

Part A of the graph is from 0s to 25s. Which of these statements is true about Part A?
The object is at rest.
The object is accelerating (its velocity is increasing)
The object is decelerating (its velocity is decreasing)
The object is moving at a constant velocity.
Part B of the graph is from 25s to 35s. Which of these statements is true about Part B?
The object is at rest.
The object is accelerating (its velocity is increasing)
The object is decelerating (its velocity is decreasing)
The object is moving at a constant velocity.
Part C of the graph is from 35s to 55s. Which of these statements is true about Part C?
The object is at rest.
The object is accelerating (its velocity is increasing)
The object is decelerating (its velocity is decreasing)
The object is moving at a constant velocity.
Part D of the graph is from 55s to 95s. During Part D, the velocity values are all negative. What does negative velocity mean?
The object is slowing down.
The object is moving in the opposite direction now.
What does a line with a positive slope mean on a velocity-time graph?
[Example sections A, E on this graph]
The object is not moving.
The object is moving, but at a constant velocity.
The object is accelerating, and its acceleration is positive.
The object is accelerating, and its acceleration is negative.
What does a flat (horizontal) line on a velocity-time graph mean?
[Example section B on this graph]
The object is not moving.
The object is moving, but at a constant velocity.
The object is accelerating, and its acceleration is positive.
The object is accelerating, and its acceleration is negative.


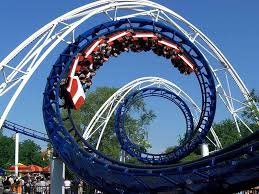

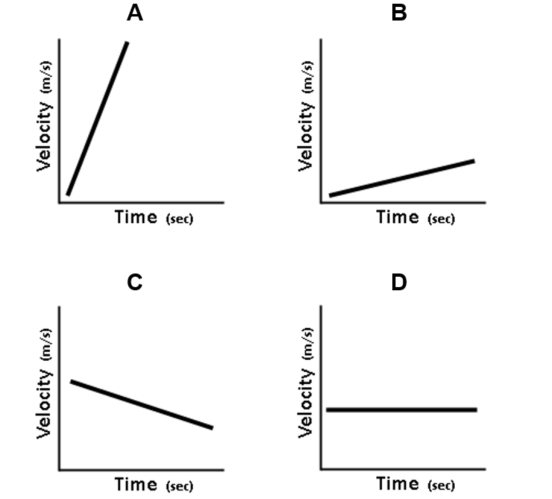

What is happening at segment E?
acceleration
deceleration
constant speed
no motion/object at rest
What is happening at segment D?
acceleration
deceleration
constant speed
no motion/object at rest

