
Font size
 Worksheets
1 D Motion
Total questions: 69
Worksheet time: 51mins
the unit of acceleration is
(m/s2)
jouls
m
s
A negative acceleration means that your object is
constant
speeding up
at rest
slowing down
A positive acceleration means that your object is
at rest
speeding up
moving
slowing down
Acceleration: is the rate of change in
velocity
speed
displacement
direction
When is an object under uniform acceleration?
none of the following
when the direction is straight
when the velocity change is constant per unit time
when the time is constant
As the ball falls towards the ground, its velocity
zero
decreases
at rest
increases
which isn't an example of acceleration
When the car is speeding up.
When the car slows down.
When you fall off a bridge.
no change in velocity
Which of the following is/are true about acceleration
Acceleration is defined as the rate of change of velocity
Its SI unit is m/s2
Negative acceleration is called retardation
none of the following
A bus starts from rest and accelerates to 14 m/s in 4 s. What is the average acceleration of the bus?
3.5 m/s2
5.9 m/s2
10.5 m/s2
24 m/s2
Which of the following objects is accelerating?
A car driving in a northwest at a constant speed of 35 mph.
A car driving southwest at a constant speed of 35 mph.
A car driving in a circle at a constant speed of 35 mph.
Back
A car driving south at a constant speed of 45 mph.




In which of the following graphs below are both runners moving at the same speed?


Why do the values on the graph form a straight line?
The speed is constant
The distance remains unchanged.
The direction of motion stays the same.
The speed gradually increases over time.
Which graph BEST represents the motion of an object that was initially at rest and is accelerating uniformly?


Describe the motion in the graph:
Constant Speed (positive slope)
Stopped (at rest)
Acceleration (increasing speed)
Return Home (negative slope)


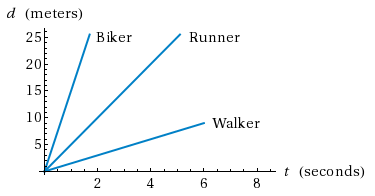
Which person moved the fastest in 3 seconds?
biker
runner
walker
they are all moving equally

What is the speed after 2 seconds?
40 m/s
20 m/s
10 m/s
40 m


The graph shows
positive velocity that's getting faster
negative velocity that's getting faster
negative velocity that's getting slower
positive velocity that's getting slower

The graph shows
positive velocity that's getting faster
negative velocity that's getting faster
negative velocity that's getting slower
positive velocity that's getting slower

The graph shows
positive velocity that's getting faster
negative velocity that's getting faster
negative velocity that's getting slower
positive velocity that's getting slower

The graph shows
positive velocity that's getting faster
negative velocity that's getting faster
negative velocity that's getting slower
positive velocity that's getting slower

The graph shows
positive velocity that's getting faster
negative velocity that's getting faster
negative velocity that's getting slower
positive velocity that's getting slower

The graph shows
positive velocity that's getting faster
negative velocity that's getting faster
negative velocity that's getting slower
positive velocity that's getting slower

The graph shows
positive velocity that's getting faster
negative velocity that's getting faster
negative velocity that's getting slower
positive velocity that's getting slower

The graph shows
positive velocity that's getting faster
negative velocity that's getting faster
negative velocity that's getting slower
positive velocity that's getting slower
The graph shows
positive acceleration
negative acceleration
constant acceleration
increasing acceleration

The graph shows
positive acceleration
negative acceleration
constant acceleration
increasing acceleration

The graph shows
positive acceleration
negative acceleration
constant acceleration
decreasing acceleration

positive acceleration
negative acceleration
slowing down
speeding up
positive velocity


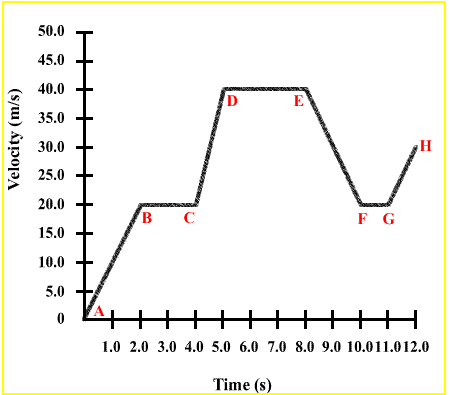

How fast is this object going at 1 second?
20 cm/s
30 cm/s
-40 cm/s
The slope of a velocity-time graph represents __________.
acceleration
displacement
speed
distance

Select the description of motion from A - B.
Slowing down away from the origin
Speeding up away from the origin
Constant velocity away from the origin
Constant velocity towards the origin

Describe the motion from B - C.
Standing still
Constant velocity of 60 m/min
Constant velocity of 0 m/min
Accelerating

What is happening at 0 m/min in the middle of segment C - D?
Nothing is happening
Change in speed
Change in position
Change in direction

Which section represents a steady speed?
A
B
C
D

Select the two correct statements that describe the object's motion.
The object is moving in the positive direction.
The object is moving in the negative direction.
The object is moving at a constant speed.
The object is speeding up.
The object is slowing down.

Select the two correct statements that describe the object's motion.
The object is moving in the positive direction.
The object is moving in the negative direction.
The object is moving at a constant speed.
The object is speeding up.
The object is slowing down.

Select the two correct statements that describe the object's motion.
The object is moving in the positive direction.
The object is moving in the negative direction.
The object is moving at a constant speed.
The object is speeding up.
The object is slowing down.

In the position time graph shown, what is the slope or velocity?
1m/s
2m/s
3m/s
4m/s

An object moves for 2 seconds at 3 m/s. Also it starts 8 meters from the origin, then df is ..
6m
12m
19m
14m

What is the velocity of this graph?
10m/s
5m/s
20m/s
1m/s

An object moves for 5 seconds at 4 m/s. Its final position is 60m, then its di is ..
20m
40m
35m
95m

Find the velocity of this object between point C and point D?
3m/s
4m/s
6m/s
40m/s

We can only be certain that during the time interval t=3s to t=6s, the object is
speeding up
speeding down
at rest
constant motion

We can only be certain that during the time interval t=2s to t=3s, the object is
speeding up
speeding down
at rest
constant motion

At what time interval is the object at rest?
t=0 to t=2
t=2 to t=3
t=3 to t=6
never

What is the displacement from position (O) to position (C)?
10m
20m
0m
15m

What is the distance from position (O) to position (C)?
10m
20m
0m
15m

From position (A) to position (B) the object is...
moving towards the origin
moving away from the origin
at rest

What kind of motion does the graph show?
constant speed
at rest
decreasing speed
increasing speed

