
 Worksheets
PIB END OF TERM EXAM
Total questions: 60
Worksheet time: 1hrs 3mins
The willingness and ability to sell the products is ....
demand
supply
sales
income
What is measured on the vertical axis of a demand diagram?
cost
wants
needs
price
The willingness and ability to purchase goods and services is called as ....
demand
supply
sales
revenue
If price of cars increase, demand of gasoline will ....
increase
same
decrease
neutral
Which of the following statements is correct?
buyers and sellers determine supply
buyers and sellers determine demand
buyers determine demand and sellers determine supply
buyers determine supply and sellers determine demand
How would an increase in supply be illustrated?
A shift to the left of the supply curve
A movement down the supply curve
A shift to the right of the supply curve
A movement up the supply curve
A change in the size of the population.
Shift in Supply
Shift in Demand
A change in the cost of inputs.
Shift in Supply
Shift in Demand
A change in consumer tastes and preferences.
Shift in Supply
Shift in Demand
A change in the price of substitute goods.
Shift in Supply
Shift in Demand
A change in the price of complimentary goods.
Shift in Supply
Shift in Demand

What does this curve represent?
Supply
Demand
Equillibrium
Quantity
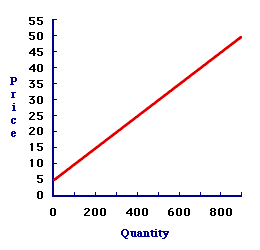
What does this curve represent?
Demand
Supply
Equilibrium
Shortage
A change in quantity demanded is shown...
at various points on the demand curve
with a new demand curve drawn above or below the original demand curve
with a vertical line
what is the name of the table that lists the quantity of a good that a single person will buy at each price in a market?
demand schedule
market map
elasticity chart
supply and demand graph
When the price of a good or service is high consumer demand will usually be ...
High
Unpredictable
Low
Average
The point where supply and demand are balanced is?
Product
Demand
Surplus
Equilibrium
The law of demand states that there is what type of relationship between price and demand?
As price decreases demand decreases.
As price increases demand increases.
As price decreases demand remains the same.
As price increases demand decreases.
The law of supply states that there is what type of relationship between price and supply?
As price decreases demand increases.
As price increases supply decreases.
As price increases supply increases.
As price decreases supply remains the same.
If the cost of computers falls, then…
the demand for computers goes up.
the supply of computers goes up.
none of the choices
the demand for computers goes down.
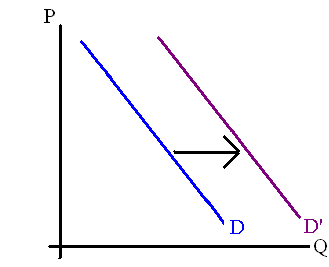

If the store has 100 packs of toilet paper and 200 people want to buy it, is it a shortage or surplus?
shortage
surplus

If there is 50 donuts made and 40 people buy them, will there be a shortage or a surplus?
shortage
surplus
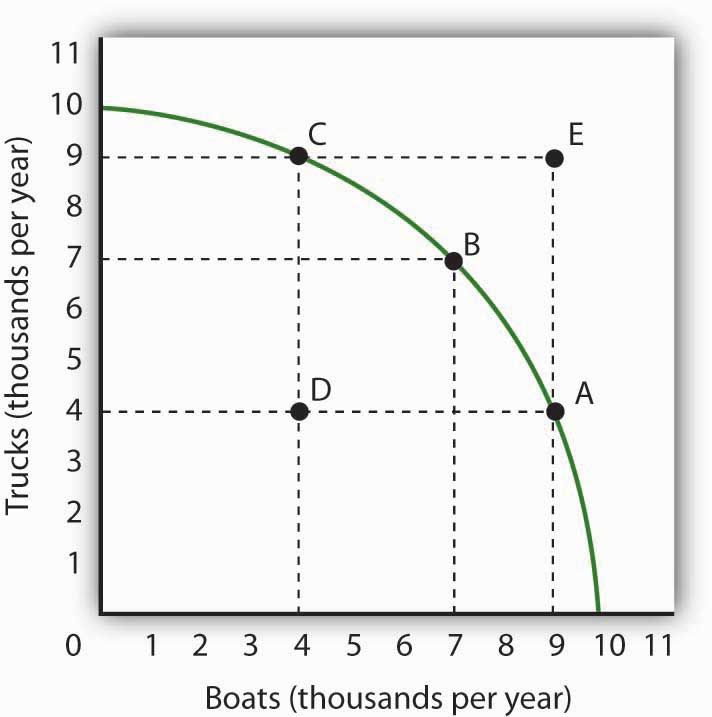
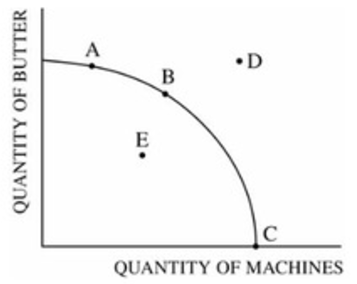
M in SMART stands for:
Modest
Meaningful
Money
Measurable
Which of the following is not a business objective?
Corporate social responsibility
Market share
Growth
Employment
What is the first and most important objective of any business organisation?
Profit Maximisation
Growth
Survival
Social Responsibility
Alan is a seller and works in an important Cafeteria in Bogota city giving services to the consumers for that reason Alan must work into the
primary sector.
secondary sector.
tertiary sector
mineral sectors.
The correct image that represents the secondary sector because transforms the raw material into goods is


Dave sells his apples crops to an apples juice factory. This factory is into the secondary sector because it involves the
transformation of raw materials into goods.
supplying of services to consumers.
extraction of raw materials from the Earth.
Import and export process.
Dave is a farmer. He has some apples crops and all the days gather this product. Apples are examples of raw material because they are
used to give services.
extracted from the earth.
important products to the Colombian economy.
imported and exported.
Some examples of workers in the tertiary sector of the economy are
miners and farmers.
lumberjack and fishers.
teachers and doctors.
factory workers.
Gold and oil can be seen as:
Land
Labour
Capital
Entrepreneurship
Identify the correct factor of production.
Skilled people working in a lawyers firm will be seen as?
Land
Labour
Capital
Entrepreneurship
Identify the correct factor of production.
Individuals with great ideas and willing to take risks.
Natural resources
Labour
Capital
Entrepreneurship
Identify the correct factor of production.
Machinery and factories are?
Land
Labour
Capital
Entrepreneurship
What are Fixed Costs?
the amount of money allocated for a business to use in certain departments
business costs, such as rent, that do not vary because of the amount of goods produced
costs that change depending upon the output
the point in a business when the profits are equal to costs
Which of the following calculations would you use to find total costs?
Fixed Costs + Variable Costs
Selling Price – Fixed Costs
Total Fixed Costs / Selling Price – Variable Cost
Total Fixed Costs/Variable Cost Per Item
If there was a rise in variable costs what effect would this have on the break even chart?
total cost line pivots downwards
fixed cost line and total cost line move upwards in a parallel shift
total cost line pivots upwards
revenue line pivots upwards
If there was a fall in fixed costs what impact would this have on the break-even output?
revenue would increase and tilt the SR line upwards
break-even is achieved at a lower level of output
greater output necessary to break-even
break-even is reached at a higher level of output
On a break-even chart, what line does the total revenue line meet at the break-even point?
The fixed cost line
The variable cost line
The total cost line
Semi variable cost line
If average variable cost is £10, and average selling price is £25, then what is contribution?
£35
£15
£-15
£40
If the average variable costs £10, average selling price is £25 and fixed costs are £60,000, then what is the break-even output?
5000
7000
6000
4000
What is a business doing when it sells output beyond the break-even point?
Making a loss
Making a profit
Making neither a profit or loss
It is not possible to tell from the graph
What is the break-even point in units for company where total fixed costs are £275,450
selling price per units £16
variable cost per unit is £14.75
220,360
183,633
150,300
225,120
What is the margin of safety?
The difference between units sold and the break-even amount
The margin between units and sales
The margin between each break-even point
The margin between profit and loss
The break even level of output for a firm is 800 units and it is currently making 950 units. What is its margin of safety?
150 units
250 units
300 units
1750 units
Two of these formulas are correct for working out the break-even point. Which two
Fixed Costs / Contribution
Total Costs - Fixed Costs x variable costs per unit
Fixed Costs / Variable cost
Contribution Margin per unit / Fixed Costs
What is an example of a fixed cost?
Rent
Packaging
Raw Materials
Wages
Anna runs a photography business. She has the following costs
Fixed costs = £30,000
Variable cost = £200 per photo shoot
Selling price: = £1000 per photo shoot
She predicts sales of 140 photo shoots for the year
What is the Total Contribution?
£112 000
£112 500
£375
£800
We are going to manufacture Whats-Its. The Whats-It machine costs £4000.It also costs £5 for materials and labour for each Whats-It. We are planning to sell our Whats-Its for £12 each. How many Whats-Its must we sell in order to breakeven?
Make sure your breakeven figure is a round number.
571.42
572
570. 63
571

